
Dividend Discount Model Calculator: Investor's Guide

TL;DR:
- A dividend discount model calculator estimates a stock’s intrinsic value by discounting expected future dividends to present value. It works best for stable companies like utilities, REITs, and Dividend Aristocrats with predictable dividend histories. The model’s accuracy depends on reliable inputs and careful analysis of growth rates and valuation assumptions.
A dividend discount model calculator estimates a stock’s intrinsic value by discounting its expected future dividends to present value. The underlying method, formally known as the Gordon Growth Model, is one of the oldest and most respected equity valuation methods in finance. Three inputs drive every calculation: the current annual dividend (D0), the expected dividend growth rate (g), and the investor’s required rate of return ®. When those inputs are reliable, the model produces a fair value estimate that tells you whether a dividend-paying stock is priced above or below what it is actually worth.
How does the dividend discount model calculator work?
The Gordon Growth Model formula is: P = D1 / (r - g), where D1 is next year’s expected dividend, r is the required rate of return, and g is the constant dividend growth rate. D1 is calculated as D0 × (1 + g). The core DDM formula requires three inputs, and each one directly shifts the fair value output.
A worked example makes this concrete. Suppose a stock pays a current annual dividend of $2.00, you expect dividends to grow at 6% per year, and your required return is 10%.
- Calculate D1: $2.00 × 1.06 = $2.12
- Apply the formula: P = $2.12 / (0.10 - 0.06)
- Solve the denominator: 0.10 - 0.06 = 0.04
- Divide: P = $2.12 / 0.04 = $53.00
If the stock trades at $45.00, the model signals it is undervalued. If it trades at $65.00, the model suggests it is overpriced relative to its dividend stream.
The required rate of return is often derived using the Capital Asset Pricing Model (CAPM): risk-free rate + Beta × market risk premium. Most equity investors use a required return between 8% and 12%. A higher required return produces a lower fair value estimate, so your choice of r carries real weight.

Pro Tip: Many stocks pay quarterly dividends. Multiply the most recent quarterly dividend by 4 to get the correct annual figure before entering it into the calculator. Failing to annualize quarterly dividends causes significant undervaluation in your results.
Which stocks are best suited for a dividend valuation calculator?
The DDM works best for stable, mature companies with predictable dividend histories. Utilities, Real Estate Investment Trusts (REITs), and Dividend Aristocrats are the clearest fits. REITs must distribute at least 90% of taxable income as dividends by law, making their payouts highly consistent and well-suited to the model’s constant-growth assumption. Dividend Aristocrats, which are S&P 500 companies that have raised dividends for at least 25 consecutive years, grow dividends at roughly 6–10% annually.
High-growth technology companies and early-stage firms are poor fits. They either pay no dividend or reinvest all earnings, so the model has nothing to discount. The table below summarizes the key differences.
| Feature | Suited for DDM | Not suited for DDM |
|---|---|---|
| Dividend history | Long, consistent record | None or irregular |
| Growth stage | Mature, stable | Early-stage or high-growth |
| Payout ratio | High and predictable | Low or zero |
| Sector examples | Utilities, REITs, consumer staples | Technology startups, biotech |
| Dividend growth rate | 5–10% annually | Not applicable |
Pro Tip: Before running any valuation, check the dividend yield calculator to confirm the stock actually pays a meaningful, consistent dividend. A yield that has jumped sharply may signal a dividend cut is coming, which would invalidate your growth assumption.
What are the main DDM variants and when should you use them?
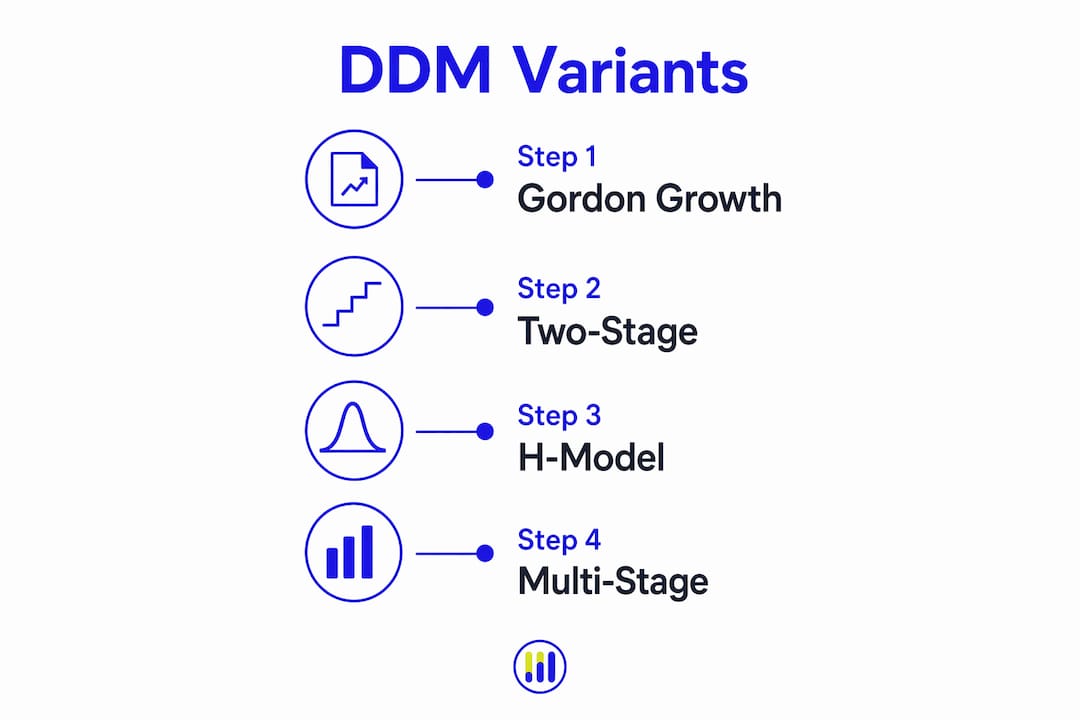
Not every dividend-paying company fits the single-stage Gordon Growth Model. Three main DDM variants address different dividend patterns.
- Zero Growth Model: Assumes dividends remain fixed forever. This applies to preferred stocks with a set payout. The formula simplifies to P = D / r. There is no growth component, so the calculation is straightforward.
- Constant Growth Model (Gordon Growth Model): Assumes dividends grow at a steady rate indefinitely. This is the standard model for mature blue-chip stocks and utilities. It requires a stable, long-term growth rate that is lower than the required return.
- Two-Stage DDM: Splits the company’s life into two phases. The first phase models a higher growth rate for a defined period (typically 5–10 years). The second phase applies a lower, sustainable terminal growth rate. This suits companies transitioning from growth to maturity.
- Three-Stage DDM: Adds a third phase for companies with a more complex growth trajectory. Analysts use it for firms moving through rapid growth, a transition period, and then stable maturity. It is more demanding on inputs but more realistic for certain industries.
Choosing the right variant depends on the company’s dividend history. If dividends have grown steadily for a decade, the constant growth model is appropriate. If a company is cutting its growth rate as it matures, the two-stage model fits better.
What pitfalls should you watch for when using a DDM financial calculator?
The DDM has real limitations, and ignoring them produces unreliable valuations. The most critical failure point is mathematical. The model breaks down if the dividend growth rate equals or exceeds the required rate of return. A denominator of zero or a negative number makes the formula invalid.
Common pitfalls include:
- Assuming growth rates are permanent. A company growing dividends at 9% today will not sustain that rate forever. Using a long-term rate above 6–7% for a mature firm is usually unrealistic.
- Ignoring dividend cuts. A single dividend reduction destroys the constant-growth assumption and makes historical growth rates meaningless as forward inputs.
- Over-relying on a single output. The model produces one number, but that number is only as good as your assumptions. Small changes in g or r shift the fair value dramatically.
- Skipping sensitivity analysis. Performing sensitivity analysis on growth and return assumptions reveals a range of intrinsic values, which is far more realistic than trusting one figure.
Valuation models are tools to test assumptions, not absolute truths. When DDM results diverge from other methods, that divergence is a signal to dig deeper, not to pick the answer you prefer.
Pro Tip: Always cross-check your DDM output with at least one relative valuation method. A P/E-based stock valuation provides a useful reality check, especially when your growth rate assumptions are aggressive.
How can you use a DDM calculator effectively in your research?
Applying the model well is as much about data quality as it is about the formula. Follow these steps to get reliable results.
- Find the current annual dividend. Check the company’s investor relations page or a financial data provider. For quarterly payers, multiply the latest quarterly dividend by 4.
- Estimate the dividend growth rate. Use the 5-year or 10-year historical dividend growth rate as your baseline. Compare it against analyst consensus estimates for forward guidance.
- Set your required rate of return. Apply CAPM or use a benchmark return that reflects the stock’s risk profile. For most dividend stocks, 8–12% is a reasonable range.
- Confirm r > g. If your growth rate is close to or above your required return, the model is invalid. Adjust your inputs or switch to a multi-stage variant.
- Run multiple scenarios. Change g by ±1% and r by ±1% to see how sensitive the fair value is to your assumptions. A wide range of outputs signals high uncertainty.
- Compare the fair value to the market price. If the market price is well below your fair value estimate, the stock may offer a margin of safety. If it trades well above, the stock may be overvalued.
Method fit is crucial: the DDM suits stable dividend payers, while discounted cash flow analysis fits companies where free cash flow matters more than dividends. Using both where applicable gives you a stronger picture.
Key Takeaways
The dividend discount model calculator is most reliable when applied to stable, dividend-paying companies with predictable growth rates and a required return that clearly exceeds the growth rate.
| Point | Details |
|---|---|
| Core formula | P = D1 / (r - g); all three inputs must be accurate for a valid result. |
| Annualize dividends | Multiply quarterly dividends by 4 before entering them into the calculator. |
| Model validity | The required return must always exceed the dividend growth rate. |
| Best-fit companies | Utilities, REITs, and Dividend Aristocrats with consistent payout histories. |
| Cross-check results | Combine DDM output with P/E or DCF analysis to validate your fair value estimate. |
The honest case for using DDM calculators with discipline
At Tickerplace, we see investors make the same mistake repeatedly: they treat a DDM output as a verdict rather than a starting point. The model is genuinely useful for mature dividend payers, but it is also unusually sensitive to small input changes. A 1% shift in your growth rate assumption can move the fair value estimate by 20% or more. That is not a flaw to dismiss. It is a signal to take sensitivity analysis seriously every time.
The investors who use DDM calculators well are the ones who run multiple scenarios, compare the output against P/E and DCF results, and stay skeptical of any single number. They also update their inputs regularly. A growth rate that was accurate two years ago may not reflect a company’s current payout trajectory. Staying current with dividend announcements and earnings reports keeps your model grounded in reality rather than outdated assumptions.
The DDM is not the right tool for every stock. Applying it to a company with an inconsistent dividend history, or one where the growth rate is close to the required return, produces numbers that look precise but are not meaningful. Knowing when not to use the model is just as important as knowing how to use it.
— Tickerplace
Tickerplace calculators for dividend stock valuation
Tickerplace provides free, institutional-grade valuation tools built specifically for individual investors who want to analyze stocks without paying for expensive research platforms.

The Stock Valuation Calculator on Tickerplace incorporates P/E and intrinsic value models that complement your dividend discount analysis. The Intrinsic Value Calculator adds a DCF-based perspective, so you can cross-check your DDM results against cash flow-driven fair value estimates. Both tools are updated daily across more than 10,000 US and ASX-listed equities. If you are building a dividend-focused portfolio, running multiple valuation models side by side is the most reliable way to identify genuinely undervalued stocks.
FAQ
What is the dividend discount model calculator formula?
The formula is P = D1 / (r - g), where D1 is next year’s expected dividend, r is the required rate of return, and g is the constant dividend growth rate. All three inputs must be accurate for the result to be meaningful.
What happens if the growth rate exceeds the required return?
The model breaks down mathematically. The denominator becomes zero or negative, producing an invalid result. Always confirm your required return exceeds your growth rate before running the calculation.
Which companies are best suited for DDM valuation?
Stable, mature companies with long dividend histories work best. Utilities, REITs, and Dividend Aristocrats are the clearest examples, given their consistent and legally mandated payout structures.
How do I find the right dividend growth rate to use?
Use the company’s 5-year or 10-year historical dividend growth rate as a baseline. Compare it against forward analyst estimates and cap your long-term assumption at a rate the company can realistically sustain.
Should I use DDM as my only valuation method?
No. DDM, DCF, and P/E analyses are complementary. Cross-checking results across methods gives you a more reliable picture of fair value than relying on any single model output.