
NVDA Intrinsic Value: What the Numbers Say in 2026

TL;DR:
- NVIDIA’s intrinsic value exceeds its current market price based on discounted cash flow and valuation models. The company’s low forward P/E indicates a valuation discount despite strong growth prospects in AI infrastructure. Risks such as spending freezes and supply-chain issues could impact its long-term fair value.
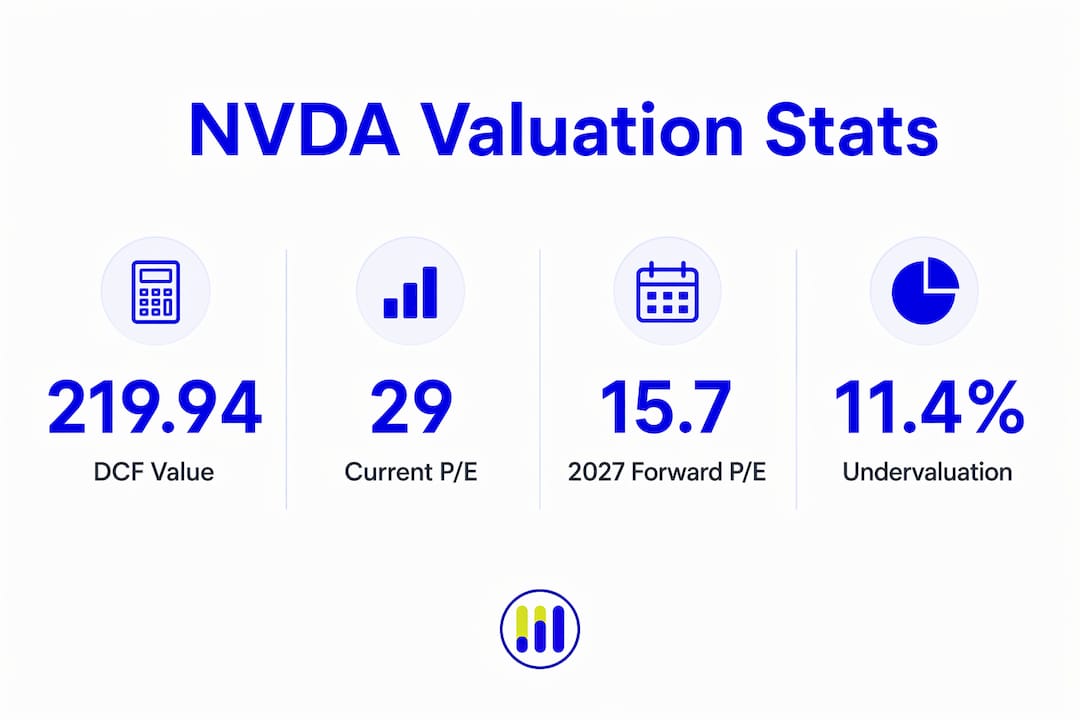
NVDA intrinsic value is defined as the estimated true worth of NVIDIA’s stock based on its fundamental cash flow generation and long-term growth potential, independent of daily market price swings. Right now, multiple valuation models point to the same conclusion: NVIDIA trades below its fair value. A DCF analysis estimates NVIDIA’s intrinsic value at $219.94 per share, roughly 11.4% above its current market price. Meanwhile, NVIDIA’s 2027 forward P/E sits at 15.7x, far below the Magnificent Seven peer average of 22.3x. For investors assessing NVIDIA’s AI-driven growth story, understanding what drives these numbers is the starting point for any serious investment decision.
What current analyst valuations reveal about NVDA’s intrinsic value
NVIDIA’s valuation multiples tell a story that the headline stock price does not. The company’s P/E ratio of roughly 29.6x sits well below the semiconductor industry average of 65.7x and the peer average of 84.1x. The fair P/E benchmark for NVIDIA’s growth profile is estimated at 63.8x. That gap between current and fair multiples signals a meaningful earnings discount.

The forward picture is equally compelling. NVIDIA’s 2027 forward P/E of 15.7x compares to a Magnificent Seven peer average of 22.3x. That means investors are paying less per dollar of projected earnings for NVIDIA than for Apple, Microsoft, or Meta. For a company at the center of AI infrastructure spending, that discount is difficult to justify on fundamentals alone.
Analyst sentiment reflects this discrepancy. Bank of America analyst Vivek Arya expects gross margins around the mid-70% range and cites durable pricing power as a core reason NVIDIA’s intrinsic value holds up under pressure. The bullish case rests on AI infrastructure demand continuing to outpace supply, while the bearish case centers on hyperscaler spending freezes and regulatory risk.
Key valuation signals at a glance:
- 2027 forward P/E: 15.7x vs. Magnificent Seven average of 22.3x
- Current P/E: ~29.6x vs. semiconductor industry average of 65.7x
- DCF intrinsic value estimate: $219.94 per share
- Analyst consensus: Gross margins in the mid-70% range support durable fair value
Pro Tip: Use a forward P/E calculator to compare NVIDIA’s projected earnings multiples against its sector peers before drawing conclusions from the current price alone.
How DCF models calculate NVIDIA’s intrinsic value
Discounted cash flow analysis is the most direct method for calculating the intrinsic value of NVIDIA stock. The model works by projecting NVIDIA’s future free cash flow, then discounting those projections back to today’s dollars using a required rate of return, often called the discount rate.
Three inputs drive most of the output in a DCF model:
- Free cash flow projections: Analysts estimate NVIDIA’s cash generation over a 5–10 year period, factoring in AI chip revenue growth, data center expansion, and operating margin trends.
- Terminal value: Because NVIDIA is expected to generate cash well beyond the projection window, a terminal value captures the present worth of all cash flows after year 10. This component often represents the majority of the total intrinsic value estimate.
- Discount rate: A higher discount rate lowers the intrinsic value estimate. Most models apply a weighted average cost of capital between 8% and 12% for NVIDIA, reflecting its growth profile and market risk.
The table below shows how these inputs interact in a simplified DCF framework:
| Input | Conservative Estimate | Base Case | Aggressive Estimate |
|---|---|---|---|
| Revenue growth (5-year) | 15% | 25% | 40% |
| Free cash flow margin | 30% | 40% | 50% |
| Discount rate | 12% | 10% | 8% |
| Implied intrinsic value | Below market | ~$219.94 | Well above market |
NVIDIA’s DCF calculation also adjusts for excess cash, total debt, and diluted share count to convert enterprise value into equity value per share. These adjustments matter because NVIDIA holds substantial cash reserves, which add directly to per-share intrinsic value.
Pro Tip: When running your own DCF for NVDA, anchor your terminal growth rate to long-run GDP plus an AI infrastructure premium. Rates above 5% require strong justification and will materially inflate your intrinsic value output.
Key growth drivers and risks affecting NVDA’s fair value
The single largest driver of NVIDIA’s intrinsic value is hyperscaler capital expenditure. AI cloud providers are projected to spend $650 billion on AI infrastructure in 2026, rising to over $1 trillion in 2027. That trajectory directly supports NVIDIA’s revenue growth assumptions in every major valuation model.
NVIDIA’s pricing power reinforces the upside. The company commands premium prices for its GPU architectures because no competitor currently matches its full-stack AI chip ecosystem. Gross margins holding in the mid-70% range confirm that pricing power is real, not aspirational.
“Investors may be mispricing NVDA by overstating supply-chain challenges while underestimating its pricing power and dominant AI market share. NVDA is increasingly viewed as a defensive position within the cyclical semiconductor sector, supported by large cash reserves and AI chip stack dominance.”
That said, three risks can compress NVIDIA’s intrinsic value estimate quickly:
- Hyperscaler capex freezes: If major cloud providers pause AI infrastructure spending, NVIDIA’s near-term revenue projections fall, and DCF outputs drop accordingly.
- Supply-chain bottlenecks: High bandwidth memory constraints and advanced packaging limitations can delay product cycles and reduce free cash flow in the near term. Investors tracking NVIDIA’s supply-chain dynamics should watch these closely.
- Valuation compression cycles: Even when fundamentals hold, sentiment-driven multiple contractions reduce the market price without changing intrinsic value. This creates a gap that patient investors can use to their advantage.
History supports the recovery case. After forward P/E contractions, accelerating operational results have typically triggered multiple expansions. The current compression may be transient rather than structural.
How to apply NVDA intrinsic value analysis to real investment decisions
Intrinsic value analysis works best as one layer in a broader NVIDIA stock analysis framework, not as a standalone buy or sell signal. Combining DCF outputs with P/E, P/S ratio analysis, and margin of safety calculations gives a more complete picture of whether the current price represents a genuine opportunity.
NVDA’s 2026 stock performance is up only 5% year to date, a sharp contrast to prior parabolic surges. That muted performance reflects market consolidation and cautious sentiment, not a deterioration in fundamentals. Investors who focus only on trailing price action miss the forward valuation signal entirely.
Practical steps for applying intrinsic value insights to your NVDA investment strategy:
- Set a margin of safety: If your DCF estimate is $219.94, consider a 15–20% margin of safety before entering. That puts a target entry price in the $176–$187 range.
- Monitor analyst forecast revisions: When institutional analysts revise their 2027 and 2028 earnings estimates upward, forward P/E multiples compress further, strengthening the undervaluation case.
- Track hyperscaler capex announcements: Quarterly earnings calls from major cloud providers are the earliest signal of whether AI infrastructure spending is accelerating or stalling.
- Reassess quarterly: Intrinsic value is not static. As NVIDIA reports earnings and updates its guidance, recalculate your DCF inputs and check whether the NVDA valuation picture has shifted.
Institutional analysts focus on multi-year forward P/E trends tied to AI capital expenditure cycles rather than single-year multiples. That longer time horizon is where the real valuation signal lives for NVIDIA.
Key Takeaways
NVIDIA’s intrinsic value, estimated at $219.94 per share by DCF models, sits above its current market price, supported by a 2027 forward P/E of 15.7x that is well below its Magnificent Seven peers.
| Point | Details |
|---|---|
| DCF intrinsic value | DCF models estimate NVDA fair value at $219.94, roughly 11.4% above current market price. |
| Forward P/E discount | NVDA’s 2027 forward P/E of 15.7x is far below the Magnificent Seven peer average of 22.3x. |
| Hyperscaler capex tailwind | AI hyperscaler spending is projected to grow from $650 billion in 2026 to over $1 trillion in 2027. |
| Valuation compression is cyclical | Historical P/E contractions at NVDA have been followed by multiple expansions as growth reaccelerates. |
| Margin of safety matters | Apply a 15–20% discount to your intrinsic value estimate before establishing a position. |
Tickerplace’s view on NVDA’s long-term intrinsic value
The valuation data on NVIDIA is unusually clear right now. A forward P/E of 15.7x for a company with mid-70% gross margins and a dominant position in AI chip infrastructure is not a sign of weakness. It is a sign that the market is pricing in near-term uncertainty while underweighting the structural growth story.
What concerns me more than the valuation multiples is the concentration risk in hyperscaler spending. If two or three major cloud providers simultaneously slow their AI capex, NVIDIA’s near-term revenue misses will be sharp, and the intrinsic value models will need to be revised downward quickly. That is the scenario most bullish analysts are not pricing in adequately.
The data center AI growth story is not a short-term trade. Investors who treat NVIDIA’s current valuation compression as a permanent discount are likely to be proven wrong over a 2–3 year horizon. The 2026 NVDA undervaluation analysis supports that view. Position sizing and a clear margin of safety remain the most important tools for managing the risk that comes with any high-growth valuation.
— Tickerplace
Tickerplace tools for calculating NVDA’s fair value
Individual investors rarely have access to the same valuation infrastructure as institutional analysts. Tickerplace closes that gap with free, institutional-grade tools built specifically for long-term investors.

The Tickerplace intrinsic value calculator applies DCF, P/E, and P/S ratio models to generate fair value estimates for NVIDIA and thousands of other US and ASX-listed equities, updated daily. The stock valuation checker gives you a fast, model-driven answer to the core question: is NVDA overvalued or undervalued right now? Both tools are free, require no account, and are built to support the kind of rigorous, forward-looking analysis that NVIDIA’s complex valuation demands.
FAQ
What is NVDA intrinsic value based on?
NVDA intrinsic value is calculated using discounted cash flow analysis, forward P/E ratios, and P/S ratio models that estimate NVIDIA’s worth based on projected free cash flow and earnings growth.
Is NVIDIA currently undervalued?
DCF models estimate NVIDIA’s intrinsic value at $219.94 per share, roughly 11.4% above its current market price, suggesting undervaluation relative to fundamental cash flow potential.
What is NVIDIA’s 2027 forward P/E ratio?
NVIDIA’s 2027 forward P/E is estimated at 15.7x, well below the Magnificent Seven peer average of 22.3x, indicating a relative valuation discount among large-cap technology stocks.
What risks could lower NVIDIA’s intrinsic value?
A freeze in hyperscaler AI capital expenditure, supply-chain bottlenecks in high bandwidth memory, and sentiment-driven multiple contractions are the primary risks that could reduce NVIDIA’s intrinsic value estimate.
How often should I recalculate NVDA’s intrinsic value?
Recalculate after each NVIDIA earnings report and after major hyperscaler capex announcements, as both events directly update the revenue and free cash flow assumptions that drive DCF outputs.