
The Role of Market Indices in Investment Strategy
TL;DR:
- Market indices track securities to reflect market trends and serve as benchmarks, baselines, and economic signals.
- They help investors assess portfolio performance, market direction, and broader economic expectations with discipline.
A market index is a statistical measure that tracks the performance of a selected basket of securities, giving investors a manageable snapshot of market trends. The role of market indices extends well beyond a single number on a screen. Indices serve three core functions: benchmarks for portfolio performance, baselines for passive investment vehicles, and economic barometers that compress complex market data into daily reference points. The S&P 500, for example, covers approximately 80% of total U.S. equity market capitalization, making it the most widely used performance standard for American equities. Understanding how indices are built, weighted, and interpreted is the foundation of sound portfolio analysis.
What is the role of market indices in modern investing?
Market indices are the standard language of performance measurement. Every institutional portfolio manager, finance student, and individual investor uses at least one index to answer a basic question: how did my portfolio perform relative to the broader market?

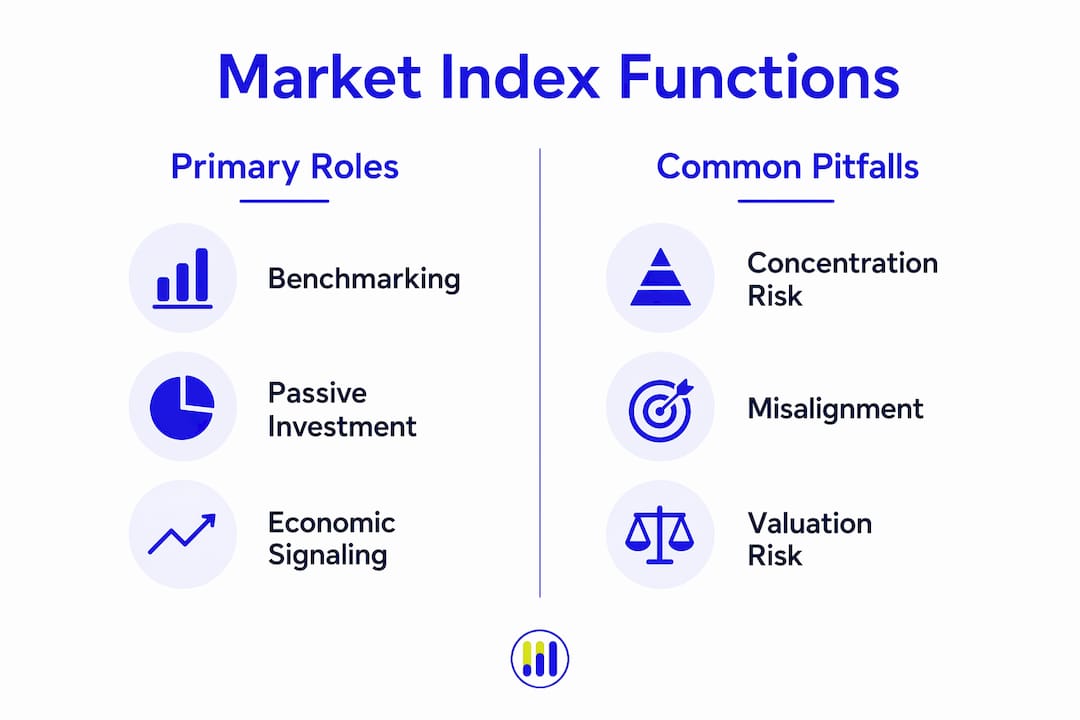
The three primary functions of a market index are benchmarking, passive investment facilitation, and economic signaling. Each function serves a distinct purpose in investment analysis. As a benchmark, an index sets the performance bar your portfolio must clear to justify active management fees. As a passive baseline, it enables index funds and ETFs to replicate market returns at minimal cost. As an economic signal, it reflects the collective expectations of millions of market participants.
The importance of market indices also lies in what they reveal about market structure. A single index reading tells you the direction of a selected group of securities. Multiple index readings, compared together, tell you which sectors, sizes, or styles are leading the market at any given time.
How are market indices constructed and weighted?
The weighting methodology of an index determines which securities exert the most influence on its daily moves. Three main approaches exist, and each produces a meaningfully different picture of market performance.
- Price-weighted indices (such as the Dow Jones Industrial Average) give more influence to higher-priced stocks, regardless of company size. A $400 stock moves the index four times more than a $100 stock, even if the cheaper company is far larger by market value.
- Market-cap-weighted indices (such as the S&P 500) assign influence proportional to a company’s total market value. Larger companies dominate the index, which means the index closely reflects where the most investor capital is concentrated.
- Equal-weighted indices give every constituent the same starting weight. This approach amplifies the contribution of smaller companies and often produces different performance results than the cap-weighted version of the same index.
Beyond weighting, two technical mechanisms keep indices accurate over time. First, reconstitution adds and removes companies as they meet or fail eligibility criteria. Second, divisor adjustments maintain index continuity after corporate actions like stock splits. Without a divisor adjustment, a stock split would artificially deflate a price-weighted index, creating a false signal of market decline.
Pro Tip: Always evaluate index movements in percentage terms, not absolute points. A 300-point move in the DJIA means something very different at 10,000 than at 40,000.
How do indices guide portfolio evaluation and investment decisions?
Indices are the primary tool for measuring whether active management adds value. The logic is straightforward: if your portfolio consistently underperforms its benchmark after fees, a low-cost index fund tracking that benchmark would have served you better.
Effective use of indices in portfolio evaluation follows a clear sequence:
- Match the benchmark to your portfolio. A small-cap growth portfolio benchmarked against the S&P 500 produces a misleading comparison. The Russell 2000 or a growth-tilted small-cap index is the correct reference point.
- Use multiple indices to identify market leadership. Comparing the performance of large-cap, mid-cap, and small-cap indices simultaneously reveals which segment of the market is driving returns, a technique known as breadth analysis.
- Assess risk with beta. Beta measures how much your portfolio moves relative to a benchmark index. A beta above 1.0 means your portfolio amplifies index moves in both directions.
- Track index funds and ETFs against their parent index. Tracking error, the gap between an ETF’s return and its benchmark, is a direct measure of execution quality for passive vehicles.
Benchmark misalignment is one of the most common analytical errors investors make. Comparing a bond-heavy portfolio to an equity index will always make the portfolio look like it underperforms, even when it is doing exactly what it was designed to do.
Pro Tip: Finance students analyzing portfolio performance should always state the benchmark explicitly before drawing any conclusions. The benchmark choice shapes every performance judgment that follows.
How do market indices function as economic barometers?
Indices compress enormous amounts of market data into a single daily signal. That compression is useful, but it requires careful interpretation. Indices reflect expectations, not confirmed economic facts. A rising index suggests that market participants expect future growth or improved liquidity. It does not confirm that the current economy is strong.
Several points define how indices function as sentiment indicators:
- A sustained rise in a broad index like the S&P 500 typically signals improving corporate earnings expectations or falling interest rate risk.
- A sharp decline often reflects fear of recession, credit stress, or geopolitical disruption, not necessarily current economic weakness.
- Specialized indices like the CBOE Volatility Index (VIX) measure implied market volatility and serve as a direct gauge of investor fear or complacency.
- Single-day index moves carry very little analytical weight without context. A 1% drop on high volume after a long rally means something different than the same drop on low volume in a sideways market.
A rising index is a signal of collective expectation, not a guarantee of economic strength. The market prices in what participants believe will happen, not what is already confirmed. Treating index direction as economic fact is the most common misreading in financial analysis.
What pitfalls should investors avoid when evaluating market indices?
Most investors misread headline indices by treating them as complete market truths rather than conditional signals. Several specific pitfalls deserve attention.
Concentration risk in cap-weighted indices is the most underappreciated structural flaw. The top 10 holdings in the S&P 500 have represented over 30% of index weight in recent years. When a handful of mega-cap technology companies drive the index higher while the majority of constituents decline, the headline number masks poor market breadth.
Comparing the cap-weighted S&P 500 to its equal-weighted version is one of the most informative checks an investor can run. When the cap-weighted version significantly outperforms the equal-weighted version, it signals that a narrow group of large companies is carrying the index. That is a breadth warning, not a broad market rally.
| Weighting method | Concentration risk | Breadth signal | Best use case |
|---|---|---|---|
| Market-cap weighted | High | Low | Tracking large-cap dominance |
| Equal weighted | Low | High | Gauging broad market participation |
| Price weighted | Medium | Low | Historical comparison (DJIA) |
Valuation risk and diversification quality are never revealed by index levels alone. An index can reach an all-time high while the average constituent trades at stretched valuations. That is why index analysis must always be paired with fundamental research at the individual stock level.
Key Takeaways
The strongest index analysis combines an understanding of weighting methodology, benchmark alignment, and comparison across multiple indices to produce a complete picture of market conditions.
| Point | Details |
|---|---|
| Indices serve three functions | Benchmarking, passive investment facilitation, and economic signaling are the core roles. |
| Weighting shapes interpretation | Cap-weighted, price-weighted, and equal-weighted indices each tell a different story about market performance. |
| Benchmark alignment matters | Matching your index to your portfolio strategy is required for valid performance comparisons. |
| Indices are forward-looking | A rising index reflects expectations of future growth, not confirmation of current economic health. |
| Breadth analysis adds depth | Comparing cap-weighted and equal-weighted versions of the same index reveals whether a rally is broad or narrow. |
Tickerplace’s take on reading indices with discipline
Most investors treat a rising index as permission to feel confident and a falling index as a reason to panic. Neither reaction is analytically sound. An index is a rule-based construct. It tells you what a specific, weighted basket of securities did on a given day. It does not tell you whether the market is cheap or expensive, whether breadth is healthy, or whether your portfolio is positioned correctly.
The investors who use indices well treat them as one input among several. They check whether the rally is broad or narrow. They compare the index level to historical valuation ranges. They ask whether their portfolio’s benchmark actually matches their holdings. These are not advanced techniques. They are basic disciplines that most investors skip because the headline number feels sufficient.
At Tickerplace, the view is that indices are tools for orientation, not substitutes for judgment. A global index comparison tells you where the market is. Fundamental analysis tells you whether individual stocks within that market are priced fairly. Both are necessary. Neither is sufficient alone.
— Tickerplace
Put index knowledge to work with Tickerplace
Understanding market indices gives you the context. Tickerplace gives you the tools to act on it.

Tickerplace is a free stock valuation and market analysis platform built for individual investors who think long term. Use the stock average price calculator to track your cost basis across index fund trades and portfolio positions. The stock valuation calculator applies DCF, P/E, and P/S models to estimate intrinsic value for thousands of U.S. and ASX-listed companies. For a broader view, the financial calculators hub includes profit/loss tracking, ROE analysis, and margin of safety tools. Tickerplace covers 10,000+ equities, updated daily, at no cost.
FAQ
What is the primary role of market indices?
Market indices serve as benchmarks for portfolio performance, baselines for passive investment vehicles like index funds and ETFs, and economic barometers that reflect collective market expectations.
How do I interpret a market index move correctly?
Evaluate index moves in percentage terms rather than absolute points, and always consider volume, breadth, and the broader economic context before drawing conclusions.
What is the difference between cap-weighted and equal-weighted indices?
Cap-weighted indices assign influence by company size, so large companies dominate. Equal-weighted indices give every constituent the same weight, producing a better signal of broad market participation.
Why does benchmark selection matter for portfolio evaluation?
A benchmark must match your portfolio’s actual exposures. Comparing a small-cap portfolio to the S&P 500 produces a misleading performance picture because the two represent different segments of the market.
What does the VIX measure in relation to market indices?
The VIX measures implied volatility derived from S&P 500 options prices. A rising VIX signals increasing investor fear or uncertainty, while a falling VIX indicates market complacency.