
Apple Intrinsic Value: How to Value AAPL Stock
TL;DR:
- Apple’s intrinsic value ranges from about $195 to $377 per share, depending on valuation assumptions. The dominant factor is terminal value, which greatly influences the overall estimate, leading to multiple scenario outcomes. The current market price exceeds most intrinsic value estimates, driven by growth expectations for AI and services that models do not fully capture.
Apple intrinsic value is defined as the estimated true economic worth of Apple Inc. derived from its fundamental financial metrics, not its current market price. At roughly $308.63 per share, Apple’s DCF intrinsic value range spans approximately $195 to $377, implying a slight margin of safety of around -7% relative to its trading price. Understanding where Apple’s fair value sits requires applying multiple valuation frameworks, interpreting their outputs as ranges rather than fixed numbers, and reconciling those outputs against what the market has already priced in. This guide walks individual investors and analysts through the core methods, the key assumptions that drive them, and how to apply them practically.
What is Apple intrinsic value and how is it calculated using DCF?
Discounted cash flow (DCF) analysis is the most widely used method for estimating the intrinsic value of Apple. The model projects Apple’s future free cash flows, then discounts them back to present value using the weighted average cost of capital (WACC) as the discount rate. A terminal value captures all cash flows beyond the explicit forecast period.
Three inputs drive most of the variation in DCF outputs:
- Free cash flow projections: Estimates of how much cash Apple generates after capital expenditures, based on revenue growth and margin assumptions.
- Discount rate (WACC): Reflects the risk of owning Apple stock. A higher WACC produces a lower intrinsic value.
- Terminal value: Captures the value of Apple’s cash flows in perpetuity. Terminal value represents 60–80% of total DCF value, making it the single most sensitive input in the model.
That terminal value dominance is the most important thing to understand about DCF analysis. Small changes in the assumed perpetual growth rate or WACC create large swings in Apple’s final intrinsic value estimate. This is why practitioners build three scenarios rather than one.
| Scenario | Assumed Growth | Estimated Intrinsic Value |
|---|---|---|
| Bear case | Conservative, low growth | ~$195 per share |
| Base case | Moderate, sustained growth | ~$280 per share |
| Bull case | Accelerated Services and AI growth | ~$377 per share |

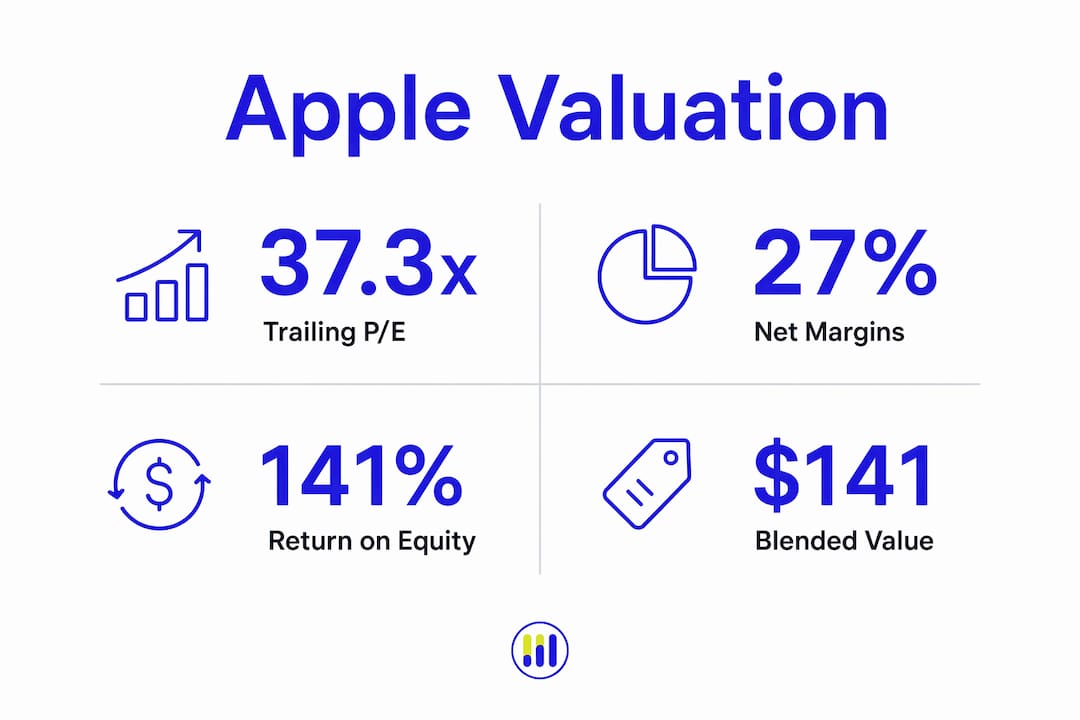
Apple currently carries a trailing P/E of 37.3x, net margins of 27%, and a return on equity of 141%. These quality metrics support the bull case assumptions but do not guarantee them.
Pro Tip: Never anchor to a single DCF output. Run at least three scenarios and weight them by probability. A 50% base, 25% bull, and 25% bear weighting gives you a more defensible fair value estimate than any single number.
What other methods estimate Apple’s fair value?
DCF is not the only lens worth applying to Apple stock valuation. Four alternative frameworks each approach the question differently, and their outputs diverge significantly from both the DCF range and the current market price.
Four canonical valuation models applied to Apple’s 2025 audited financials produce a blended intrinsic value near $141 per share, far below the current trading price. That gap signals a 50–67% premium that the market assigns to Apple beyond what traditional models justify.
| Model | Core Input | Typical Apple Range |
|---|---|---|
| Free cash flow to equity | Projected FCF, cost of equity | $101–$116 per share |
| Dividend discount model (DDM) | Dividends, growth rate, discount rate | $100–$140 per share |
| Residual income model | Book value, excess returns | $101–$116 per share |
| Valuation multiples (P/E, P/S) | Sector median multiples | Near sector median |
Each model has a distinct strength. The DDM works well for dividend-paying companies but underweights Apple’s buyback-heavy capital return program. The residual income model anchors to book value, which understates Apple’s intangible assets and brand. Multiples analysis is fast and market-anchored but circular: it tells you what the market pays, not what Apple is worth.
The practical takeaway is that reconciling multiple model outputs produces a more reliable picture than relying on any single framework. When DCF points to $280 and residual income points to $110, the spread itself is informative. It tells you how much of Apple’s current price depends on growth assumptions that have not yet materialized.
Why does Apple’s market price differ from intrinsic value estimates?
Apple’s market price consistently trades at a premium to most intrinsic value estimates. Apple’s trailing P/E of 37.3x sits 17% above the technology sector median, reflecting expectations that go well beyond what historical cash flows justify.
Several forces drive that premium:
- AI adoption expectations: The market prices in future revenue from Apple Intelligence and AI-integrated hardware cycles that no current cash flow model can fully capture.
- Services segment growth: Apple’s Services division carries higher margins than hardware. Investors assign a premium for this mix shift, which traditional models underweight.
- Market sentiment and risk appetite: In periods of low interest rates or high risk appetite, investors accept lower implied returns, which mechanically inflates price-to-value ratios.
- Information asymmetry: Institutional investors with proprietary supply chain and demand data may price Apple differently than models built on public financials alone.
The key question is not what Apple’s exact intrinsic value is. The key question is which growth assumptions are already priced by the market and whether those assumptions are realistic. A stock trading at a large premium to model-based fair value may reflect information that models do not capture, or it may reflect overestimated future growth. Disciplined investors distinguish between the two.
Pro Tip: When Apple’s market price sits well above your intrinsic value estimate, check your terminal growth rate assumption first. If you are using a rate below what the market implies, the gap may be a modeling artifact rather than a genuine overvaluation signal.
How to apply Apple’s intrinsic value to your investment decisions
Applying intrinsic value analysis to Apple stock requires more than running a model. The output is a starting point, not a verdict.
- Calculate a margin of safety. Compare your base-case intrinsic value estimate to the current price. A negative margin of safety, as Apple currently shows at roughly -7%, means the stock trades near or above fair value. That is not a sell signal by itself, but it narrows the room for error.
- Use scenario-weighted ranges. Assign probabilities to your bull, base, and bear cases. A probability-weighted valuation range is more useful than a single point estimate because it forces you to quantify your uncertainty.
- Layer in qualitative factors. Apple’s brand, ecosystem lock-in, and capital allocation discipline are real competitive advantages. These factors temper raw DCF outputs and justify a premium over purely quantitative estimates. Ignoring them produces a model that is technically correct but practically misleading.
- Monitor continuously. Intrinsic value changes as Apple reports earnings, revises guidance, or shifts its capital return program. Use a stock valuation checker to track whether the gap between price and fair value is widening or narrowing over time.
- Avoid single-model dependence. If your only tool is DCF, you will miss what the DDM and residual income models reveal about Apple’s dividend sustainability and book value creation. Cross-checking models is not redundant. It is how you catch flawed assumptions before they cost you.
Key Takeaways
Apple’s intrinsic value is best understood as a range of estimates across multiple models, not a single number, and the gap between those estimates and the current market price reflects growth expectations that investors must evaluate critically.
| Point | Details |
|---|---|
| DCF range for Apple | Intrinsic value spans roughly $195 to $377 per share depending on growth and discount rate assumptions. |
| Terminal value dominance | Terminal value drives 60–80% of DCF output, making growth rate and WACC the most critical inputs to stress-test. |
| Alternative models signal a lower floor | Free cash flow, DDM, and residual income models converge near $101–$141, far below the current market price. |
| Market premium reflects expectations | Apple’s 37.3x P/E sits 17% above the sector median, pricing in AI and Services growth that models cannot yet quantify. |
| Scenario analysis over point estimates | Probability-weighted bull, base, and bear scenarios produce more reliable investment guidance than any single DCF output. |
Tickerplace’s take on valuing Apple
Valuing Apple is genuinely difficult, and most investors underestimate why. The challenge is not running the model. The challenge is choosing the right assumptions and knowing which ones the market has already priced in.
The single biggest mistake Tickerplace sees individual investors make is treating a DCF output as a verdict. It is not. A DCF model is a structured way to make your assumptions explicit so you can debate them. When Apple’s model-based fair value sits at $141 and the stock trades at $308, the right response is not to conclude the stock is overvalued and move on. The right response is to ask what growth rate justifies $308 and whether you believe Apple can deliver it.
Scenario analysis is the discipline that separates rigorous valuation from guesswork. Assign a probability to each scenario. Weight the outputs. Then compare that weighted estimate to the current price. If the market price only makes sense under your most optimistic assumptions, you have identified your real risk. That is the insight that drives better decisions. You can review a detailed breakdown of these methods in the 2026 Apple valuation guide on Tickerplace.
— Tickerplace
Tickerplace tools for Apple stock valuation
Tickerplace provides free, institutional-grade valuation tools built specifically for individual investors who want to go beyond surface-level price analysis.

The intrinsic value calculator lets you input your own growth rate, discount rate, and margin assumptions to generate a DCF-based fair value estimate for Apple or any other stock. The stock valuation calculator adds P/E and P/S ratio analysis alongside DCF, giving you a multi-model view in one place. Both tools update daily across more than 10,000 US and ASX-listed equities. If you want to see where Apple’s current price sits relative to its estimated fair value right now, the AAPL valuation page on Tickerplace gives you that answer without a subscription.
FAQ
What is Apple’s intrinsic value per share?
Apple’s DCF-based intrinsic value ranges from approximately $195 to $377 per share depending on growth and discount rate assumptions, with a base case near $280. Alternative models like DDM and residual income produce lower estimates near $101–$141.
Is Apple stock overvalued based on intrinsic value?
At a trailing P/E of 37.3x, Apple trades 17% above the technology sector median and near the top of most DCF ranges. Whether that constitutes overvaluation depends on whether you believe the market’s implied growth assumptions for AI and Services are achievable.
What is the DCF method for valuing Apple?
DCF analysis projects Apple’s future free cash flows and discounts them to present value using WACC. Terminal value, which captures cash flows beyond the forecast period, represents 60–80% of the total DCF output and is the most sensitive input in the model.
How does margin of safety apply to Apple stock?
Margin of safety measures the gap between intrinsic value and market price. At current prices, Apple shows a margin of safety of approximately -7% relative to its base-case DCF estimate, meaning the stock offers little buffer against downside surprises.
Why do different valuation models give different results for Apple?
Each model uses different inputs and assumptions. DCF relies on projected free cash flows; DDM focuses on dividends; residual income anchors to book value. Apple’s intangible assets, buyback program, and growth expectations affect each model differently, producing a wide range of fair value estimates.