
Intrinsic Value of Apple Stock: 2026 Investor Guide

TL;DR:
- The intrinsic value of Apple stock is estimated between $196 and $379 based on discounted cash flow analysis. Currently, the market price offers a margin of safety near only +1%, indicating the stock is close to fair value. Significant model sensitivity and uncertainty suggest investors should wait for pullbacks before buying.
The intrinsic value of Apple stock is the estimated true worth of AAPL shares based on discounted future cash flows and fundamental financial analysis, not the current market price. Apple Inc. (Ticker: AAPL) sits among the most analyzed equities on the planet, yet most investors still confuse its market price with its actual value. Understanding the difference between what the market charges and what the business is worth gives you a real edge. Valuation models like discounted cash flow (DCF), price-to-earnings (P/E), and the PEG ratio each answer a different part of that question, and knowing how to read them together is what separates disciplined investors from speculators.
How is the intrinsic value of Apple stock calculated using DCF models?
The discounted cash flow model is the most rigorous method for estimating Apple’s fair value. It works by projecting Apple’s future free cash flows and discounting them back to today’s dollars using the weighted average cost of capital (WACC). The result is a present value that represents what the business is theoretically worth right now.

Apple’s fiscal Q2 2026 results give analysts strong inputs to work with. The company reported $111.2 billion in quarterly revenue, a 17% year-over-year increase. Gross margin came in at 47.86% and operating margin at 32.27%. Those are exceptional numbers for a company of this scale, and they form the foundation of any credible DCF model.
Here is how a standard DCF for Apple is built:
- Project free cash flows. Analysts start with Apple’s operating cash flow, which exceeded $28 billion in Q2 2026 alone, then model growth rates across a 5–10 year forecast window.
- Choose a discount rate (WACC). This reflects Apple’s cost of capital and the risk embedded in the forecast. Small changes here have large effects on the final number.
- Estimate a terminal growth rate. This is the assumed long-run growth rate after the forecast period ends. Terminal value typically accounts for 60–80% of total intrinsic value in a DCF model, making this assumption the single most consequential input.
- Discount all cash flows back to present value. Sum the discounted cash flows plus terminal value to arrive at intrinsic value per share.
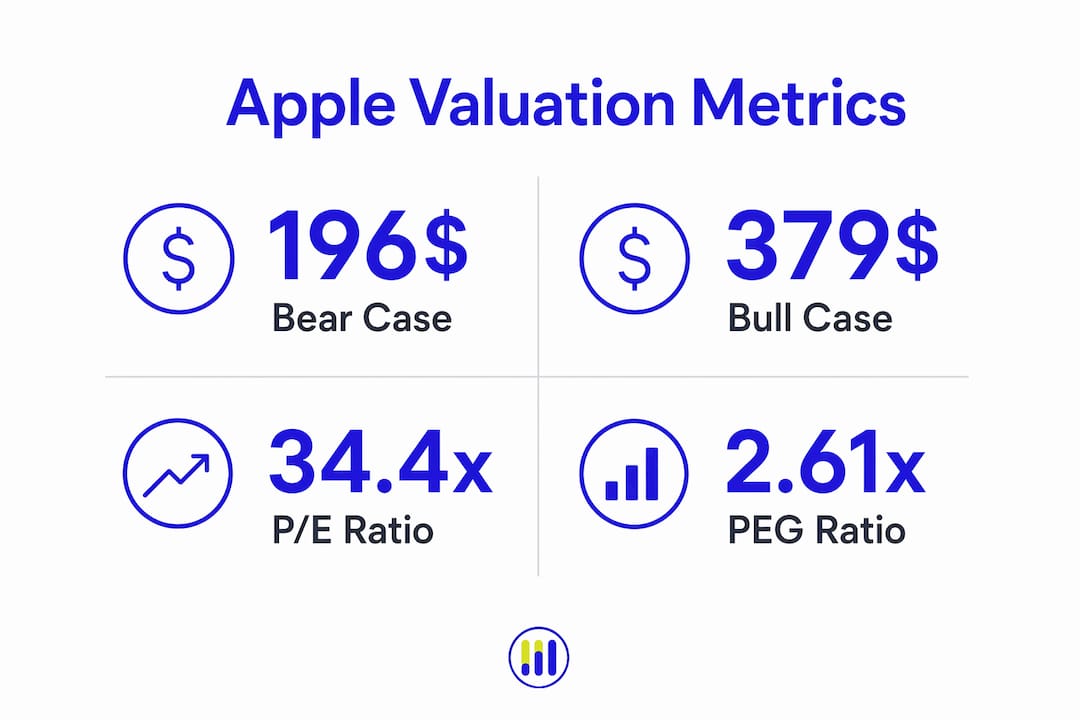
Professional analysts applying this method to Apple currently produce a DCF intrinsic value range of $196 to $379, reflecting bear and bull case assumptions respectively. That $183 spread is not a flaw in the model. It is the model doing its job by showing you the range of plausible outcomes.
Pro Tip: Never anchor to a single DCF output. Treat the bear case as your downside test and the bull case as the ceiling you need sustained growth to justify. The midpoint is your base case, not a guaranteed target.
What do P/E, PEG, and margin of safety reveal about Apple’s valuation?
Valuation multiples give you a faster read on how the market prices Apple relative to its earnings and growth. Apple’s trailing P/E ratio sits between 34.4x and 36.1x as of mid-2026. That is a significant premium above the broader technology sector median. Investors paying that multiple are betting that Apple’s earnings will grow fast enough to justify the price.
The PEG ratio adds growth context to the P/E. Apple’s PEG ratio of 2.61x means the market is pricing in substantial future growth. A PEG above 2.0x generally signals that a stock is pricing in optimistic growth expectations. You can read more about how to interpret this metric on the PEG ratio guide from Tickerplace.
| Metric | Apple (AAPL) | Technology sector context |
|---|---|---|
| Trailing P/E | 34.4x–36.1x | Premium above sector median |
| PEG Ratio | 2.61x | Signals high growth expectations |
| Gross Margin | 47.86% | Well above hardware sector average |
| Operating Margin | 32.27% | Reflects strong software and services mix |
| Margin of Safety | ~+1% | Near-zero buffer at current price |
The margin of safety is the gap between intrinsic value and market price. At the DCF midpoint, Apple’s margin of safety sits near +1%. That near-zero buffer means the stock is priced close to fair value at current levels, leaving little room for error if growth disappoints.
Pro Tip: A margin of safety below 15–20% is a signal to wait, not act. Disciplined value investors target a meaningful discount to intrinsic value before committing capital. Check Apple’s current valuation status on Tickerplace’s AAPL valuation checker for an up-to-date read.
What causes variability in Apple’s intrinsic value estimates?
Apple’s fair value estimates vary widely because DCF models are highly sensitive to a small number of inputs. A 1% change in terminal growth rate or WACC can swing the intrinsic value by tens of billions of dollars. That sensitivity explains why credible analysts produce estimates ranging from $196 to $379 for the same company using the same general method.
The key sources of variability include:
- Terminal growth rate. Analysts who believe Apple will sustain above-average growth through AI integration and new product categories assign higher terminal rates, pushing intrinsic value up.
- Discount rate (WACC). A higher WACC reflects greater perceived risk and compresses the present value of future cash flows. Even a 0.5% increase in WACC meaningfully reduces the fair value estimate.
- Revenue growth assumptions. Apple’s 17% year-over-year revenue growth in Q2 2026 is strong, but sustaining that rate requires successful execution on new categories.
- Product innovation outcomes. Market pricing reflects expectations of continued growth from products like smart glasses and AI services. A failed launch or delayed rollout resets those assumptions and compresses the valuation.
- Return on equity. Apple’s ROE of 141.47% signals exceptional capital efficiency, which supports premium valuation multiples. But that metric can decline if Apple deploys capital into lower-return ventures.
DCF outputs are best used as scenario analyses, not as fixed price targets. Each scenario tests a different set of assumptions about Apple’s future. The investor’s job is to decide which scenario is most plausible, not to accept any single number as truth.
How should investors apply intrinsic value insights to buying or holding Apple?
Apple stock price analysis is only useful if it connects to a clear investment decision. The core question is whether the current market price offers a reasonable entry point relative to the range of intrinsic value estimates. At a near-zero margin of safety, the answer today is cautious.
Practical steps for applying Apple stock valuation insights:
- Compare price to the valuation range. If the market price sits near the bear case estimate of $196, the risk-reward improves significantly. Near the bull case of $379, you are paying for perfection.
- Wait for pullbacks. Apple’s premium multiples mean that any negative earnings surprise or macro shock can create a better entry point. Patience is a position.
- Monitor quarterly results. Apple’s strong Q2 2026 financials set a high bar. Each subsequent quarter either validates or undermines the growth assumptions baked into the current price.
- Use multiple models together. DCF, P/E, and PEG each capture a different dimension of value. No single model is sufficient. Cross-referencing them reduces the risk of anchoring to one flawed assumption.
- Recalibrate after major news. Product launches, earnings reports, and regulatory developments all shift the inputs. Your intrinsic value estimate should update when the facts change.
You can use Tickerplace’s intrinsic value calculator to run your own DCF scenarios with Apple’s current financial inputs and test how sensitive your estimate is to different growth and discount rate assumptions.
Key Takeaways
Apple’s intrinsic value is best understood as a probability-weighted range, not a single number, and the current market price leaves almost no margin of safety at the DCF midpoint.
| Point | Details |
|---|---|
| DCF range is wide by design | Bear case is $196, bull case is $379; the spread reflects legitimate uncertainty, not model error. |
| Terminal value dominates | 60–80% of Apple’s DCF value comes from terminal assumptions, making growth rate choice critical. |
| Premium multiples carry risk | A P/E of 34–36x and PEG of 2.61x price in strong growth; any slowdown compresses the multiple fast. |
| Margin of safety is near zero | At the DCF midpoint, the current price offers roughly +1% safety buffer, signaling caution for new buyers. |
| Recalibrate with each quarter | Apple’s Q2 2026 results set a high bar; future quarters will confirm or challenge current valuation assumptions. |
Tickerplace’s take on valuing Apple in 2026
The most common mistake investors make with Apple is treating a single analyst price target as a fact. Tickerplace has worked through enough valuation models to know that a $379 bull case and a $196 bear case for the same stock are both defensible. The difference is not analytical error. It is the honest result of uncertainty about Apple’s long-term growth trajectory.
What Tickerplace finds more useful than any single target is understanding what the current market price implies. If Apple trades near $297, the market is essentially betting on a specific growth path. Your job as an investor is to decide whether you agree with that bet. Long-term growth expectations hinge on Apple successfully launching new product categories and monetizing AI. Those are real opportunities, but they are not guaranteed.
Tickerplace’s view: treat Apple’s intrinsic value as a range, assign your own probability to each scenario, and only buy when the price gives you a genuine cushion. Consensus price targets are a starting point for analysis, not a conclusion.
— Tickerplace
Put Apple’s valuation numbers to work
Tickerplace gives individual investors the same valuation tools that institutional analysts use, at no cost.

The stock valuation calculator runs P/E and intrinsic value models side by side, so you can see how Apple’s current price compares to fair value under different assumptions. The stock valuation checker gives you an instant read on whether AAPL is overvalued or undervalued right now, updated daily. For investors tracking their Apple position over time, the stock average price calculator helps you monitor your cost basis and assess where you stand relative to intrinsic value. All tools are free, no account required.
FAQ
What is the intrinsic value of Apple stock right now?
Analysts using DCF models estimate Apple’s intrinsic value in a range of approximately $196 (bear case) to $379 (bull case), with the midpoint suggesting the current market price offers a margin of safety near +1%.
How does Apple’s P/E ratio compare to the technology sector?
Apple’s trailing P/E of 34.4x–36.1x sits at a premium above the technology sector median, reflecting market expectations for sustained earnings growth above the industry average.
What is a PEG ratio and why does Apple’s matter?
The PEG ratio adjusts the P/E for expected growth. Apple’s PEG of 2.61x signals the stock prices in substantial future growth; if that growth slows, the multiple is likely to compress.
Why do Apple intrinsic value estimates vary so widely?
A 1% change in terminal growth rate or WACC can shift Apple’s DCF valuation by tens of billions of dollars, which is why credible analysts produce a wide range of estimates rather than a single figure.
Is now a good time to buy Apple stock based on intrinsic value?
At the current DCF midpoint, Apple’s margin of safety is approximately +1%, which is well below the 15–20% buffer most value investors require before committing capital.