Beta in stocks: essential guide for risk analysis
Beta is one of the most cited metrics in stock analysis, yet it remains one of the most misunderstood. Many investors assume that chasing high returns automatically means accepting high risk, but that framing misses a critical distinction: not all risk is the same, and not all volatility is equal. Beta gives you a precise, quantifiable way to measure how a stock moves relative to the broader market. This guide breaks down what beta means, how it is calculated, and how you can use it to make sharper, more confident investment decisions.
Key Takeaways
| Point | Details |
|---|---|
| Beta defines stock volatility | Beta measures how much a stock’s price moves in relation to the overall market. |
| CAPM uses beta for expected return | Beta is a key factor in models that predict expected investment returns and risk. |
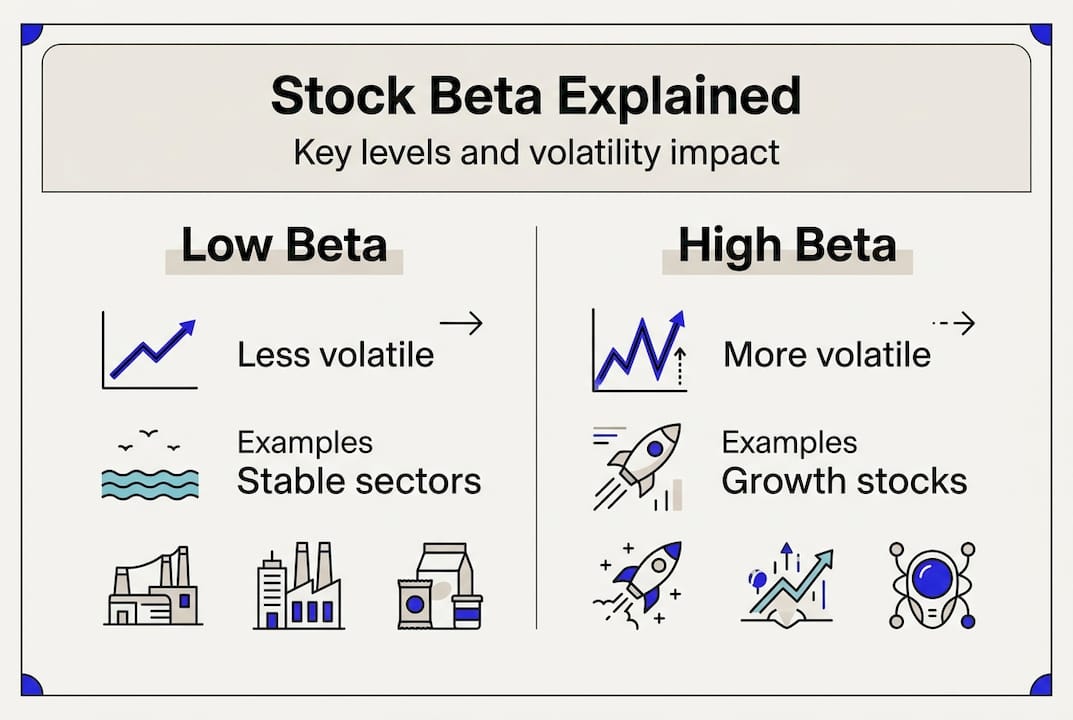
| High beta means more risk | Stocks with higher beta values tend to be more volatile and carry more risk but can also offer greater returns. |
| Beta is one of many metrics | Investors should combine beta with other financial ratios for a better risk and performance analysis. |
What is beta in stocks?
Beta is a numerical measure that tells you how much a stock tends to move in relation to a benchmark, typically the S&P 500. A stock’s volatility relative to the market) is what beta captures, making it a foundational concept in modern portfolio theory and risk assessment. When you are analyzing stocks for your portfolio, beta is one of the first metrics worth examining.
Here is how to interpret the most common beta values:
-
Beta = 1: The stock moves in line with the market. If the S&P 500 rises 10%, the stock is expected to rise roughly 10% as well.
-
Beta > 1: The stock is more volatile than the market. A beta of 1.8 suggests the stock could move 80% more than the index in either direction.
-
Beta < 1: The stock is less volatile. Utility companies and consumer staples often fall into this category.
-
Beta < 0: The stock moves inversely to the market. Gold-related equities sometimes exhibit negative beta during market downturns.
Key takeaway: Beta does not measure absolute risk. It measures relative risk compared to a market benchmark. A stock with a beta of 0.5 can still lose value; it simply tends to lose less than the broader market during a downturn.
Understanding this distinction is essential before you apply beta to any real investment decision.
How is beta calculated?
Beta is derived from historical price data using statistical regression. The calculation compares the returns of a specific stock against the returns of a market index over a defined period, typically 36 to 60 months. Here is a simplified step-by-step breakdown:
-
Collect historical returns for both the stock and the benchmark index over the same time period.
-
Calculate the covariance between the stock’s returns and the market’s returns. Covariance measures how the two move together.
-
Calculate the variance of the market’s returns over the same period.
-
Divide covariance by variance: Beta = Covariance (Stock, Market) / Variance (Market).
The CAPM formula uses beta) to determine the expected return of an asset: E(Ri) = Rf + β (Rm - Rf), where Rf is the risk-free rate, Rm is the expected market return, and β is the stock’s beta. For example, if the risk-free rate is 3%, the expected market return is 9%, and a stock has a beta of 1.4, the expected return would be: 3% + 1.4 × (9% - 3%) = 11.4%.
Tools like the PE ratio calculator, CAGR calculator, and P/B ratio calculator complement beta analysis by giving you a fuller picture of valuation and growth.
Statistic callout: A stock with a beta of 2.0 is statistically expected to move twice as much as the market. In a year where the S&P 500 gains 15%, that stock could theoretically gain 30%, but in a down year of 15%, it could lose 30%.
| Beta value | Volatility level | Typical stock type |
|---|---|---|
| Less than 0 | Inverse to market | Gold, inverse ETFs |
| 0 to 0.5 | Very low | Utilities, bonds |
| 0.5 to 1.0 | Below average | Consumer staples, healthcare |
| 1.0 | Market average | Index funds |
| 1.0 to 1.5 | Above average | Large-cap tech |
| Greater than 1.5 | High | Biotech, small-cap growth |
Beta’s role in risk and expected returns
Beta sits at the core of how professional investors think about portfolio risk. To use it well, you need to understand the difference between two types of risk: systematic risk and unsystematic risk.
Systematic risk is market-wide risk that affects all stocks, such as interest rate changes, inflation, or geopolitical events. Unsystematic risk is company-specific, such as a product recall or a leadership change. Only systematic risk is priced in CAPM), which is why beta, as a measure of systematic risk, carries so much weight in expected return calculations.
Here is a comparison of high beta versus low beta stocks to clarify the tradeoff:
| Factor | High beta stocks | Low beta stocks |
|---|---|---|
| Volatility | High | Low |
| Potential return | Higher in bull markets | More stable across cycles |
| Downside risk | Greater in bear markets | Limited relative to market |
| Typical sectors | Tech, biotech, energy | Utilities, consumer staples |
| Investor profile | Aggressive, growth-focused | Conservative, income-focused |
For investors building a balanced portfolio, combining high and low beta stocks can smooth out overall volatility. Metrics like the PEG ratio calculator and EPS calculator help you evaluate whether the expected return from a high-beta stock is actually justified by its growth fundamentals.
Key considerations when using beta for risk management:
-
Beta is backward-looking; it reflects historical behavior, not guaranteed future movement.
-
A stock’s beta can shift significantly after major corporate events like mergers or earnings surprises.
-
Sector rotation can change the beta profile of entire industries over time.
Pro Tip: Beta is a powerful starting point, but it should never be your only risk metric. Pair it with standard deviation, the Sharpe ratio, and fundamental analysis for a complete risk picture.
Applying beta in stock analysis
Knowing how to calculate beta is one thing. Knowing how to apply it in real investment decisions is where the real value lies. Beta helps investors measure risk) and expected performance across different market conditions, making it a practical tool for both stock selection and portfolio construction.
Consider two real-world scenarios. First, biotech stocks with different betas illustrate how dramatically beta can vary within a single sector. A large-cap biotech with a diversified pipeline might carry a beta of 1.2, while a clinical-stage company with a single drug candidate could have a beta above 2.5. Both are in the same sector, but their risk profiles are entirely different. Second, when scanning the NASDAQ stock list, you will notice that technology-heavy indices tend to feature higher average betas than the broader S&P 500, reflecting the growth-oriented, higher-volatility nature of those listings.
Here is how traders and investors typically apply beta in practice:
-
Portfolio construction: Blend high and low beta stocks to target a specific overall portfolio beta that matches your risk tolerance.
-
Market timing: In a confirmed bull market, tilting toward higher beta stocks can amplify gains. In uncertain or bearish conditions, rotating into lower beta names can reduce drawdowns.
-
Sector analysis: Compare a stock’s beta to its sector average. A stock with a lower beta than its peers may offer relative stability within an otherwise volatile industry.
-
Position sizing: Use beta to adjust position sizes. A higher beta stock warrants a smaller position to keep its contribution to overall portfolio risk proportional.
The stock average price calculator is a useful companion tool when you are managing positions across multiple entry points in a high-beta stock.
Pro Tip: Always interpret beta in context. A beta of 1.3 for a utility stock is unusual and worth investigating. The same beta for a software company is entirely expected. Sector norms matter.
Common mistakes investors make with beta include relying on it as a standalone measure of safety, ignoring the time period used to calculate it, and failing to update their beta assessments after significant market or company events.
Analyze stocks smarter with Tickerplace
Understanding beta is a strong foundation, but applying it effectively requires the right tools at your fingertips. Tickerplace brings together real-time data, fundamental metrics, and screening capabilities so you can act on insights like beta without switching between multiple platforms.

Use the advanced stock screener to filter stocks by beta range alongside other key metrics, helping you quickly identify candidates that match your risk profile. The stock return calculator lets you model expected performance based on different beta scenarios and market conditions. For a broader view of market trends, indices, and top movers, the full suite of stock market research tools on Tickerplace gives you everything you need to build and monitor a well-informed portfolio.
Frequently asked questions
What does a beta of 1.5 mean for a stock?
A beta of 1.5) means the stock is expected to be 50% more volatile than the market, potentially offering higher returns in bull markets but also greater losses during downturns.
Can beta help predict future returns?
Beta is used in models like CAPM to estimate) expected return based on market risk, but it does not guarantee future results since it relies on historical data.
Does a low beta mean a safe stock?
A low beta indicates less volatility than the market), but it does not eliminate other risks such as poor earnings, high debt, or sector-specific headwinds that beta simply does not capture.
How can I use beta in choosing stocks?
Match beta to your risk-based strategy) by selecting higher beta stocks for aggressive growth portfolios and lower beta stocks for conservative, income-focused approaches.