
Explaining Top Losers: What Every Investor Should Know

Top losers are the stocks that recorded the largest percentage decline over a chosen period, whether intraday, daily, or across a 52-week window. That single data point does not tell you whether a stock is a bargain or a deteriorating business. Before acting on any name from a top-losers list, check three things first: confirm the catalyst from SEC filings or credible news, verify that trading volume is meaningfully above average, and run a quick fundamental check against the company’s revenue and earnings trend. Stocks appearing on the S&P 500 or Nasdaq daily decliners lists range from genuine value opportunities to permanent capital-loss candidates, and the difference is almost never visible from the percentage decline alone.
Table of Contents
- How are top losers measured, and what distorts the rankings?
- Where can you find reliable top-losers data?
- What do top losers reveal about the market or a specific company?
- How should you analyze a top loser before acting?
- How do traders and investors use top-losers lists differently?
- What red flags should stop you from buying a top loser?
- A hands-on example: screening and valuing a top loser
- Key Takeaways
- The responsible way to use top-losers lists
- Tickerplace tools for analyzing top losers
- Useful sources for further research
- FAQ
How are top losers measured, and what distorts the rankings?
Top losers are ranked by the largest percentage decline over a defined period, not by the absolute dollar amount lost. That distinction matters more than most investors realize.
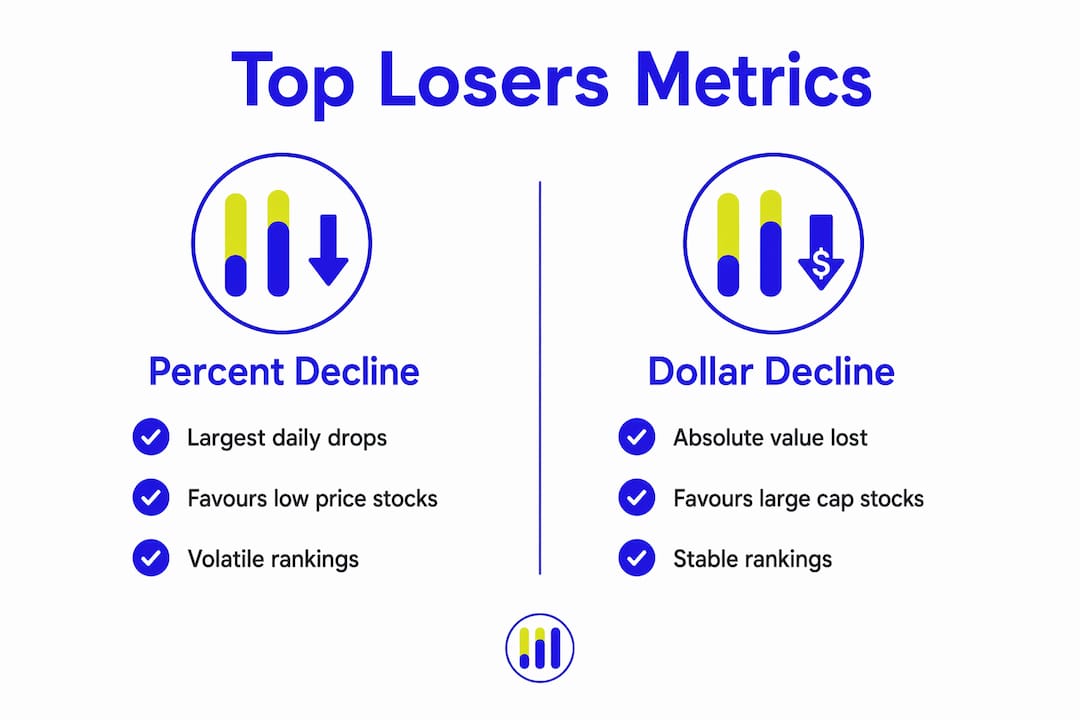
Percent decline vs. absolute dollar decline. Percent-based rankings are the standard on most market sites because they normalize across price levels. A $1 stock dropping $0.50 shows a 50% decline; a $1,000 stock dropping $20 shows only 2%, even though the dollar loss per share is forty times larger. Percent rankings will almost always surface low-priced stocks at the top of the list, which is why filtering by market capitalization is a necessary second step.
Common timeframes and when each is useful:
- Intraday: Captures real-time moves; useful for day traders but highly susceptible to noise and thin-volume distortions.
- Daily (close-to-close): The most widely cited timeframe; reflects a full session’s conviction.
- 5-day / 30-day: Useful for swing traders identifying multi-session trends.
- 52-week low / YTD: Preferred by value-oriented investors looking for extended underperformance relative to the broader market.
How low-price and low-float stocks distort rankings. Penny stocks and micro-cap names with tiny floats can swing 40–60% on minimal dollar volume, flooding percent-based lists with names that have no institutional following and very little liquidity. A $0.30 stock moving to $0.18 is a 40% decline on paper, but the underlying move may represent a few thousand dollars of actual trading activity.
| Metric | Percent Decline | Absolute Dollar Decline |
|---|---|---|
| Standard use | Most daily losers lists | Rarely used for rankings |
| Distortion risk | High for low-price stocks | High for high-price stocks |
| Best for | Comparing across price levels | Assessing portfolio dollar impact |
| Filter needed | Minimum market cap, minimum price | Minimum share price |
Where can you find reliable top-losers data?
Daily losers lists are published by Yahoo Finance, TradingView, Google Finance, and Barchart, and they typically rank tickers by percent decline alongside volume and market-cap columns. MarketBeat’s biggest percentage decliners page adds indicator columns that make quick scanning more efficient.

Public aggregator pages are fast but static. They show a snapshot at whatever moment you load the page, with no ability to filter by minimum market cap, average volume, or sector. Broker platform screeners, by contrast, let you set persistent filters, save alerts, and layer in technical conditions. That flexibility is what separates a useful workflow from a list you glance at and forget.
For a stock screening checklist that walks through the filter logic step by step, the Handy.Markets beginner guide is a practical starting point before you build your own saved screen.
Pro Tip: Always confirm whether a quoted decline is intraday or close-of-day before acting. An intraday figure can reverse sharply in the final hour of trading. Cross-reference the volume column: a large decline on below-average volume often reflects thin liquidity rather than genuine selling conviction.
What do top losers reveal about the market or a specific company?
Top losers can reflect sector-wide selloffs, company-specific bad news, or forced liquidation from margin calls and lockup expirations. Distinguishing between these three causes is the first analytical step.

A company-specific catalyst, such as an earnings miss, a guidance cut, or a regulatory action, typically produces a sharp, isolated decline that does not spread to peers. When several names within the same sector appear on the same day’s losers list, that clustering usually signals a broader rotation or macro event rather than individual company failure. The 2026 SaaS selloff is a clear example: Intuit fell over 55% and Accenture over 45% within the same period, driven by fears that AI tools would displace their core revenue streams, not by idiosyncratic company problems.
Market context changes how you should read any losers list. In a sustained bull market, a stock appearing on the daily decliners list stands out precisely because the broader tape is rising. That contrast can indicate a genuine company-level problem worth investigating. In a bear market or broad correction, the list fills with otherwise-sound businesses caught in indiscriminate selling, and the signal-to-noise ratio drops considerably. Knowing which environment you are operating in shapes whether a top loser deserves a closer look or a pass.
How should you analyze a top loser before acting?
Investors should check filings and credible news sources for the catalyst as the very first step. The following numbered checklist mirrors the order that experienced analysts typically follow.
Immediate checks:
- Find the catalyst. Search SEC EDGAR for recent 8-K filings. Check financial news for earnings releases, guidance revisions, FDA decisions, or legal announcements. No catalyst found often means the move is noise or a delayed reaction to broader selling.
- Compare volume to the 30-day average. High-volume declines signal institutional selling and stronger conviction; low-volume drops can be erratic or liquidity-driven. A decline on two to three times average volume carries far more weight than one on half the average.
- Check for trading halts or gap history. A stock that has been halted for regulatory reasons or that shows repeated gap-down openings carries elevated risk.
Follow-up fundamental checks:
- Revenue trend over the past four quarters: is it growing, flat, or declining?
- Earnings per share trajectory: one miss is different from three consecutive misses.
- Free cash flow: a company burning cash with no clear path to profitability is structurally different from one with a temporary earnings shortfall.
- Debt-to-equity ratio: high leverage amplifies downside risk in a declining business. The Tickerplace debt-to-equity calculator makes this check fast.
- Valuation benchmarks: compare current P/E and price-to-sales ratios to sector medians and to the stock’s own historical range.
Screener thresholds to apply before trading:
- Minimum average daily volume: 500,000 shares (filters out illiquid micro-caps)
- Minimum market cap: $300 million (reduces penny-stock noise)
- RSI below 30: flags technically oversold conditions worth watching
- Price relative to 200-day moving average: a cross below the 200-day often indicates a persistent downtrend
Risk controls before entering a position:
- Size the position so a 20% further decline does not exceed your pre-defined maximum loss per trade.
- Set a stop-loss level before entry, not after.
- Avoid margin or leverage on a stock already in a sharp decline; forced liquidation risk compounds quickly.
A deeper walkthrough on combining technical and fundamental checks is available in Tickerplace’s stock analysis guide.
How do traders and investors use top-losers lists differently?
The right approach depends almost entirely on your time horizon and risk tolerance.
Short-term traders use daily and intraday losers lists to find high-volatility setups. The focus is liquidity, intraday reversal patterns, and whether the decline has exhausted itself. A stock down 15% on heavy volume in the first hour may attract mean-reversion buyers by midday, but only if the catalyst is temporary and the float is large enough to support orderly trading. DO verify that average daily volume exceeds 500,000 shares before entering. DON’T trade a halted or thinly traded name expecting a quick bounce.
Swing traders look for multi-session setups where a stock has declined sharply over three to ten days and shows early signs of stabilization, such as narrowing daily ranges or volume drying up on down days. The catalyst check still applies, but the holding period allows more time for the fundamental picture to clarify.
Value-oriented long-term investors use top-losers lists, particularly 52-week and YTD versions, as a starting screen for potential undervaluation. The key discipline here is separating a price decline from a thesis deterioration. Professional investors differentiate between price volatility and thesis deterioration; holding a position expecting recovery without checking fundamentals risks permanent capital loss. DO run a full DCF or P/E valuation before concluding a stock is cheap. DON’T buy solely because the percentage decline looks dramatic.
What red flags should stop you from buying a top loser?
Short interest and borrow rates can signal persistent downward pressure or squeeze potential and should be checked for any top loser. Beyond short interest, the following signals warrant extra caution or a full pass:
- Trading halt or pending regulatory action: a halt for “news pending” or an SEC investigation announcement changes the risk profile entirely.
- Insolvency or restructuring announcement: Chapter 11 filings or debt-restructuring news typically signal that equity holders face severe dilution or total loss.
- Extreme short interest above 30% of float: combined with a rising borrow rate, this suggests sophisticated capital is positioned against the stock.
- Three or more consecutive quarters of declining revenue: this pattern points to structural deterioration, not a temporary setback.
- Insider selling at scale: check SEC Form 4 filings; multiple executives selling in the weeks before a large decline is a meaningful warning.
- Tiny float below 5 million shares: illiquid stocks can gap down further on minimal sell orders, making exit difficult.
For the SEC filings check, go to EDGAR (sec.gov) and search the ticker. Prioritize 8-K filings from the past 30 days, which capture material events. In the most recent 10-Q or 10-K, focus on the liquidity section, going-concern language, and any covenant violations disclosed in the debt footnotes. A stock monitoring process guide from Handy.Markets covers the ongoing filing-review workflow in more detail.
A hands-on example: screening and valuing a top loser
The following walkthrough applies the checklist to a hypothetical candidate. The steps are replicable on any ticker.
Step 1: Set screener thresholds. Open the Tickerplace stock screener and apply the filters below.
| Filter | Threshold | Why it matters |
|---|---|---|
| Average daily volume | ≥ 500,000 shares | Removes illiquid micro-caps |
| Market cap | ≥ $300 million | Reduces penny-stock distortion |
| RSI (14-day) | ≤ 30 | Flags technically oversold names |
| 1-day price change | ≤ −8% | Captures meaningful single-session declines |
| Debt-to-equity ratio | — | Screens out highly leveraged names |
Step 2: Find the catalyst. Suppose the screener surfaces a mid-cap software company down 12% on the day. An 8-K filed that morning shows the company cut its annual revenue guidance by 9%. That is a company-specific catalyst, not a sector-wide move.
Step 3: Verify volume and short interest. Volume is running at 2.8 times the 30-day average, consistent with institutional selling. Short interest is 14% of float, elevated but not extreme.
Step 4: Run a quick intrinsic-value check. Use the Tickerplace stock valuation calculator to model a P/E scenario using the revised earnings estimate and a DCF scenario using a conservative growth rate. If the resulting fair value is still above the current price by a meaningful margin, the decline may have created a margin-of-safety opportunity. If fair value is at or below the current price even after the drop, the stock is not cheap.
Verdict template:
Catalyst: guidance cut (−9% revenue); Volume: 2.8× average (conviction sell); Fundamentals: revenue growth slowing, cash flow positive; Valuation gap: fair value 18% above current price; Short interest: 14% of float; Action: Watch — add to watchlist, revisit after next earnings call before committing capital.
A quantitative approach with custom screeners is more reliable than eyeballing daily percent lists, and this template gives you a repeatable structure for every candidate.
Key Takeaways
Top losers are only useful as a starting point; the percentage decline alone tells you nothing about whether a stock is worth buying, avoiding, or watching.
| Point | Details |
|---|---|
| Measurement matters | Percent-based rankings distort toward low-price stocks; always filter by minimum market cap and volume. |
| Catalyst first | Check SEC 8-K filings and credible news before any other analysis step. |
| Volume confirms conviction | High-volume declines signal institutional selling; low-volume moves are often noise. |
| Separate price from thesis | A falling price is not the same as a broken business; verify revenue and earnings trends before acting. |
| Use Tickerplace tools | The Tickerplace screener and valuation calculators apply the filters and intrinsic-value checks described above. |
The responsible way to use top-losers lists
Top-losers lists are one of the most misused tools in retail investing. The percentage decline is visible and emotionally compelling, which is exactly why it tends to short-circuit careful analysis. Tickerplace’s view is straightforward: treat any name from a daily decliners list as a research prompt, not a buy signal. The screening and valuation workflow described above exists precisely to slow that impulse down and replace it with a repeatable process.
The fundamental analysis guide on Tickerplace covers the valuation mechanics in more depth for investors who want to build that process into their regular routine. The goal is not to avoid top-losers lists entirely; it is to use them as a filter, not a conclusion.
Tickerplace tools for analyzing top losers
Free institutional-grade valuation without the institutional price tag is what Tickerplace was built to deliver, and that matters most when you are evaluating a stock under pressure. The stock valuation checker gives you an immediate over/undervalued read on any US-listed ticker using DCF, P/E, and P/S models, updated daily. The intrinsic value calculator lets you model margin-of-safety scenarios with your own growth assumptions. The stock screener applies every threshold from the checklist above in one saved filter set.

For position sizing and loss analysis after you identify a candidate, the stock average price calculator and profit/loss calculator handle the math quickly. Tickerplace Pro unlocks full DCF breakdowns, scenario analysis, and historical financials for deeper due diligence. Start with the free tools at tickerplace.com and upgrade when your analysis demands it.
Useful sources for further research
- SEC EDGAR: Primary source for 8-K, 10-Q, and 10-K filings; use it to verify catalysts and check for going-concern language.
- Yahoo Finance / Barchart / TradingView: Live daily and intraday losers lists with volume and market-cap columns; best for a quick first scan.
- MarketBeat biggest percentage decliners: Adds technical indicator columns to the standard decliners view.
- Tickerplace screener: Custom filter-based screening with saved alerts; apply the thresholds from the checklist above.
- Tickerplace valuation tools: DCF, P/E, intrinsic value, and margin-of-safety calculators for any US or ASX-listed company.
FAQ
What does “top losers” mean in the stock market?
Top losers are the stocks that recorded the largest percentage decline over a chosen period, such as a single trading day, a week, or a 52-week window. The ranking is almost always percent-based rather than absolute dollar decline.
Is it a good idea to invest in top-losing stocks?
Top losers can become buying opportunities when the decline is driven by temporary sentiment rather than fundamental deterioration, but they are value traps when revenue and earnings are structurally declining. Always verify the catalyst, volume, and valuation before committing capital.
How do you identify top-losing stocks worth analyzing?
Apply screener filters for minimum average daily volume (500,000 shares), minimum market cap ($300 million), and RSI below 30, then check SEC filings for the catalyst. The Tickerplace stock screener lets you save these thresholds as a reusable filter set.
What is the 7% loss rule?
A common position-management guideline suggests investors sell a stock if it falls a small fixed percentage below their purchase price, limiting downside before a loss compounds. It is a risk-control discipline, not a valuation framework, and works best when combined with a pre-defined entry thesis.
What does Warren Buffett say about declining stocks?
Buffett’s consistent position is that price declines in fundamentally sound businesses create buying opportunities, but only when the underlying competitive position and earnings power remain intact. He distinguishes sharply between a stock that is cheaper and a business that is weaker.