
TL;DR:
- An oversold stock has a low Relative Strength Index below 30, indicating potential undervaluation. Combining RSI signals with significant price drops and fundamental analysis helps identify true recovery opportunities. Using stock screeners accelerates research while patience and thorough validation separate winners from speculative trades.
An oversold stock is defined as a stock whose price has dropped sharply enough that its Relative Strength Index (RSI) falls below 30, signaling potential undervaluation and a possible rebound. This technical threshold is the standard starting point for identifying stocks that markets may have punished too severely. Investors who spot these conditions early can position themselves ahead of price corrections. The key is combining technical signals like RSI with fundamental analysis to separate genuine recovery candidates from stocks in permanent decline. Tools like the Tickerplace stock screener make this process faster and more systematic for individual investors.
What are oversold stocks and how does RSI identify them?
RSI, or Relative Strength Index, measures the speed and magnitude of price changes to signal oversold and overbought conditions. It is calculated on a scale of 0 to 100, typically over a 14-day period, and refreshed daily by financial screeners. A reading below 30 is the standard oversold threshold, indicating that selling pressure has been unusually heavy relative to buying activity.
RSI is widely used in technical analysis for entry and exit timing. When a stock’s RSI drops below 30, it does not guarantee a rebound. It signals that the stock has been sold aggressively and may be trading below its fair value.
Key facts about RSI and oversold readings:
- RSI below 30 is the standard oversold signal used by most screeners and analysts.
- RSI between 30 and 40 is a cautionary zone, often used in broader screening strategies.
- RSI above 70 signals overbought conditions, the opposite extreme.
- 14-day period is the default calculation window, though some traders use shorter windows for more sensitivity.
- RSI alone is not sufficient. False signals occur frequently, especially in trending bear markets.
Pro Tip: Set your RSI filter to below 40 rather than the strict 30 threshold when building a watchlist. This wider net captures stocks entering oversold territory before they hit the most extreme readings, giving you more time to research before acting.
How to combine price decline and RSI to find the best candidates
Combining RSI with a price decline filter produces more reliable results than using RSI alone. Screening S&P 500 stocks with an RSI below 40 and a price drop of at least 20% from the 52-week high isolates stocks hit primarily by market volatility rather than business failure. This dual-criteria approach reduces false positives significantly.

The table below illustrates how this screening logic applies to real examples from 2026:
| Stock | RSI Signal | Price Drop from 52-Week High | Key Fundamental Note |
|---|---|---|---|
| Roper Technologies | Oversold | Significant decline | 11% revenue growth in Q1 2026; Moderate Buy rating |
| Macy’s | Oversold | Significant decline | Low P/E ratio; real estate assets exceed market cap |
| Microsoft | Oversold (Nasdaq) | 20%+ decline | Strong recent revenues; sector rotation impact |
| T-Mobile | Oversold (Nasdaq) | 20%+ decline | Strong revenues; upside potential up to 72% cited |
Nasdaq tech stocks affected by sector rotation show upside potential ranging from +20% to +72%, with Microsoft and T-Mobile among the examples carrying strong revenue despite price drops. That range reflects how dramatically market sentiment can diverge from business reality.
Pro Tip: Run your screen at market close rather than during trading hours. Intraday RSI fluctuates widely, and end-of-day readings give you a cleaner, more stable signal to act on.
What fundamental factors should you check before buying?
Technical signals identify candidates. Fundamental analysis determines whether those candidates are worth buying. Distinguishing between a price drop caused by business deterioration versus market overreaction is the most critical step in oversold stock analysis.
Macy’s is a clear example of a stock where fundamentals support the technical signal. The company’s real estate asset value exceeds its market capitalization, it pays a dividend above 3%, and its sales have shown recovery. Roper Technologies posted 11% revenue growth in Q1 2026 alongside its oversold RSI reading, which analysts interpreted as a Moderate Buy with 43% upside potential. These are the kinds of data points that separate a value opportunity from a value trap.
Green flags to look for:
- Revenue growth or stable earnings over recent quarters
- Dividend payments with a sustainable payout ratio
- Low price-to-earnings (P/E) ratio relative to sector peers
- Asset value (real estate, intellectual property, cash reserves) exceeding market cap
- Analyst consensus ratings of Buy or Moderate Buy
Red flags that suggest permanent decline:
- Consecutive quarters of falling revenue and earnings
- Rising debt-to-equity ratio with no clear path to reduction
- Dividend cuts or suspensions
- Loss of market share to competitors
- Regulatory or legal risks not yet priced in
Reviewing company fundamentals before committing capital is not optional. It is the step that separates disciplined investors from those who mistake a cheap price for a good deal.
How to use stock screeners effectively to find oversold stocks
Stock screeners are the most efficient tool for identifying oversold candidates at scale. Screeners filter stocks by RSI, price decline, market capitalization, sector, and dozens of other metrics simultaneously, cutting hours of manual research down to minutes.
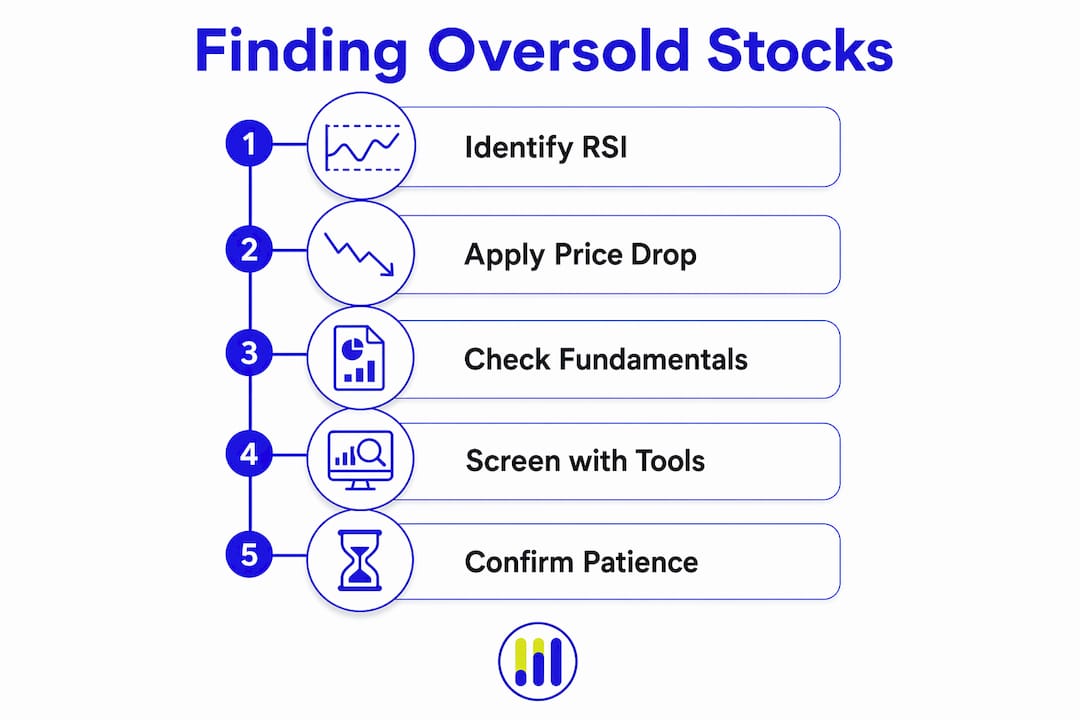
A practical workflow for finding and analyzing oversold stocks:
- Set your RSI filter. Start with RSI below 40 to capture a broader pool, then narrow to below 30 for the most extreme readings.
- Add a price decline filter. Filter for stocks down at least 20% from their 52-week high to confirm meaningful selling pressure.
- Limit to a defined universe. Applying filters to S&P 500 or Nasdaq-listed stocks reduces noise and focuses on companies with established track records.
- Sort by sector. Sector rotation often drives oversold conditions in otherwise healthy companies. Grouping by sector helps identify whether the weakness is company-specific or industry-wide.
- Pull the fundamentals. For every stock that passes the technical screen, review revenue trends, earnings, dividend history, and analyst ratings before making any decision.
The Tickerplace screener offers customizable filters for both novice and experienced investors, covering RSI, price performance, and fundamental metrics in one interface. Pairing screener output with the platform’s educational resources gives you a complete picture before you commit capital.
Key Takeaways
Oversold stocks identified by RSI below 30 and confirmed by a 20%+ price decline require fundamental validation to distinguish genuine recovery opportunities from stocks in structural decline.
| Point | Details |
|---|---|
| RSI below 30 is the threshold | An RSI reading under 30 signals heavy selling and potential undervaluation in a stock. |
| Dual-criteria screening works better | Combining RSI below 40 with a 20%+ price drop from the 52-week high reduces false signals. |
| Fundamentals confirm the signal | Revenue growth, low P/E ratios, and asset value separate recovery candidates from value traps. |
| Real examples guide the process | Roper Technologies and Macy’s show how technical and fundamental signals align in practice. |
| Screeners accelerate research | Tools like the Tickerplace screener apply multiple filters simultaneously to surface candidates fast. |
The discipline that actually separates winners from losers
At Tickerplace, we have watched investors make the same mistake repeatedly: they find a stock with a low RSI, see a big price drop, and buy immediately. The technical signal is real. The problem is the missing step between the screen and the trade.
The investors who consistently profit from oversold conditions are not faster. They are more patient. They wait for the RSI signal, then spend time on the fundamentals before touching a position. Roper Technologies in 2026 is a good example. The RSI was oversold, but the 11% revenue growth in Q1 was the actual reason to buy. Without that confirmation, the trade is speculation.
The other mistake we see is treating every oversold reading as equal. A stock down 20% from its 52-week high in a sector rotation is a very different situation from a stock down 20% because its largest customer canceled a contract. The price chart looks the same. The business reality does not.
Patience and research are not glamorous. They are, however, the two factors that consistently separate investors who profit from oversold conditions from those who simply buy cheap stocks and wonder why they keep losing money.
— Tickerplace
Tickerplace tools for oversold stock research
Identifying oversold stocks requires both the right filters and the right data. Tickerplace brings both together in one place.

The Tickerplace stock screener lets you filter by RSI, price decline from 52-week highs, sector, market cap, and fundamental metrics simultaneously. You can build a custom screen in minutes and move directly into company-level analysis without switching platforms. For investors building their analytical skills, the Tickerplace investing education hub covers everything from RSI interpretation to reading financial statements, so your screening decisions are grounded in real understanding. Whether you are identifying your next position or stress-testing an existing one, Tickerplace gives you the data and tools to act with confidence.
FAQ
What does it mean when a stock is oversold?
A stock is oversold when its RSI falls below 30, indicating that selling pressure has pushed the price significantly below its likely fair value. This condition often precedes a price rebound, though confirmation through fundamental analysis is required.
How do I find oversold stocks quickly?
Use a stock screener with RSI and price decline filters. Setting RSI below 40 and filtering for stocks down 20% or more from their 52-week high surfaces the strongest candidates efficiently.
Is an oversold stock always a good buy?
No. An oversold RSI reading signals potential undervaluation but does not confirm it. Fundamental validation is required to rule out stocks whose price dropped due to deteriorating business performance rather than market overreaction.
What is the difference between oversold and undervalued stocks?
Oversold is a technical condition based on RSI and price momentum. Undervalued is a fundamental condition based on metrics like P/E ratio, asset value, and earnings. A stock can be both, as with Macy’s in 2026, or one without the other.
How reliable is RSI for identifying oversold conditions?
RSI is a widely used and respected indicator, but it produces false signals in sustained downtrends. Combining RSI with price decline filters and fundamental checks, as outlined in this guide, produces more reliable results than relying on RSI alone.