
Explaining Company Fundamentals: Investor's Guide
TL;DR:
- Company fundamentals reflect a business’s financial health and help determine if it is worth owning.
- They include financial metrics like revenue and cash flow, operational efficiency, and qualitative factors such as management quality.
Company fundamentals are the core quantitative and qualitative inputs that determine a business’s financial health and intrinsic value. For long-term investors, they answer the question that matters most: is this business worth owning at the current price? Earnings and cash flow, not short-term price swings, are the primary drivers of long-term investment returns, which is why fundamental analysis focuses on the business behind the ticker rather than market noise.
When you evaluate a company’s fundamentals, you are essentially building a picture of what the business earns, how efficiently it operates, and whether management is allocating capital wisely. That picture then feeds into a valuation, which tells you whether the market price reflects reality or has drifted too far in either direction.
The core fundamentals to watch fall into three groups:
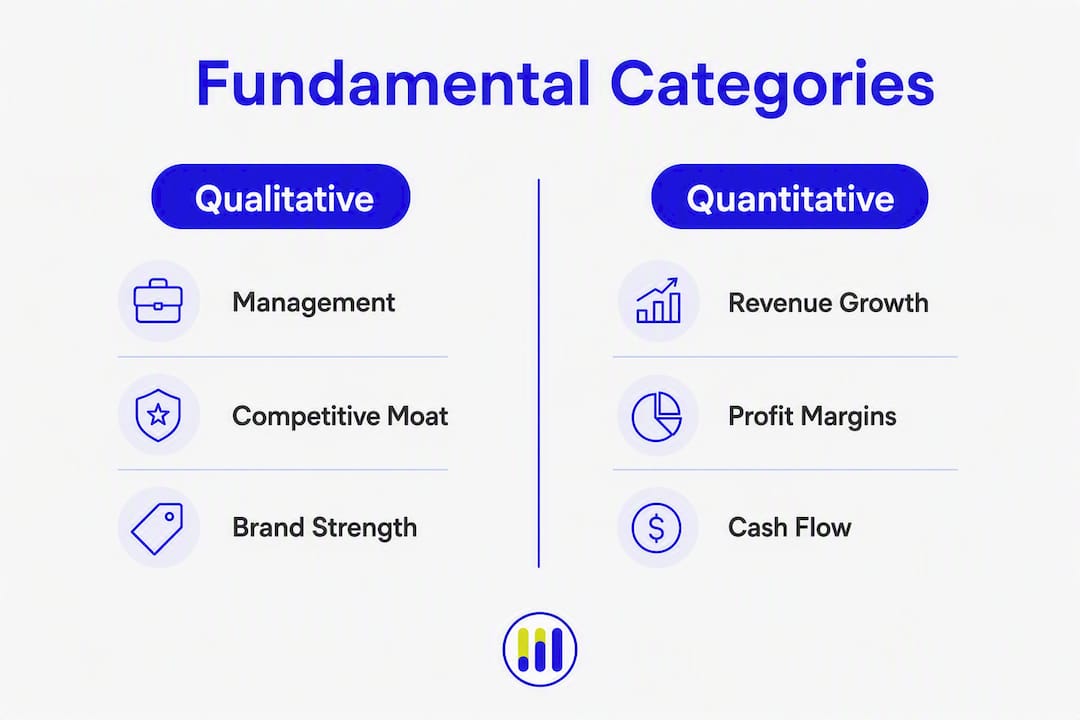
- Financial: Revenue, earnings per share (EPS), net income, free cash flow (FCF), and profit margins
- Operational: Market share, unit economics, return on invested capital (ROIC), and operating efficiency
- Qualitative: Business model durability, competitive moat, management quality, and corporate governance
What do company fundamentals actually include?
Fundamental analysis groups a company’s inputs into three practical categories, and understanding how each one contributes to your investment thesis is the first step toward reading any stock with confidence.

Financial metrics
These are the numbers reported directly in the financial statements. Revenue tells you how much the business sells; earnings tell you how much it keeps after costs; free cash flow tells you how much cash is actually generated after capital expenditures. Sustained revenue growth signals runway for reinvestment and market share gains. Expanding margins signal pricing power or operational discipline.
- Revenue: Is the top line growing steadily?
- Net income and EPS: What profit does the business generate per share?
- Free cash flow: How much cash remains after capital expenditures?
Operational metrics
Operational metrics sit between the financial statements and the qualitative story. Return on invested capital measures how efficiently management deploys every dollar of capital. Gross margin reveals how much pricing power the company holds before overhead enters the picture. Market share trajectory indicates whether the business is gaining or ceding ground to competitors.
- Gross and operating margins: How much of each revenue dollar survives after cost of goods and operating expenses?
- ROIC: Does management earn returns above the cost of capital?
- Unit economics: Is each customer or product profitable on a standalone basis?
Qualitative aspects
Qualitative factors are harder to quantify but often explain why two companies with similar financials trade at very different multiples; understanding corporate banking structures can shed light on organizational influences affecting company performance. A durable competitive moat, whether from network effects, switching costs, or brand strength, protects margins over time. Corporate governance and board oversight affect capital allocation decisions and executive incentives, both of which show up in ROIC over the long run. Management’s track record of investing in high-ROIC projects versus returning capital to shareholders is a material signal of business quality.
Different investor styles weight these categories differently. Growth investors lean heavily on revenue growth rates and total addressable market. Value investors prioritize earnings yield, free cash flow, and balance sheet strength. Income investors focus on dividend sustainability, payout ratios, and leverage. Understanding your own framework helps you decide which fundamentals to prioritize when screening.
How do the three financial statements work together?
The three core financial statements are the balance sheet, the income statement, and the statement of cash flows. Each answers a different question, and reading them together gives you a complete picture of financial health.
Balance sheet
The balance sheet is a snapshot of what the company owns (assets), what it owes (liabilities), and what is left for shareholders (equity) at a specific date. Key measures to check first: the current ratio (current assets divided by current liabilities, a gauge of short-term liquidity), total debt levels relative to equity, and book value per share. A current ratio below 1.0 means the company may struggle to meet near-term obligations.
Income statement
The income statement covers a period of time, typically a quarter or a year, and shows revenue flowing down through gross profit, operating income, and net income. Read trends first, not single-period snapshots. Gross margin stability signals pricing power; operating margin expansion signals cost discipline. EPS is the bottom line per share, but always check whether it is diluted (accounting for stock options and convertible securities) and whether it is growing in line with revenue.

Statement of cash flows
The cash flow statement separates cash generated from operations, cash used in investing activities, and cash from financing. Operating cash flow is the most important line for fundamental investors because it shows whether the business actually converts earnings into cash. Free cash flow and the cash flow statement often reveal issues hidden by accrual-based earnings; a company can report positive GAAP net income while burning cash due to rising receivables or heavy capital expenditure. When operating cash flow consistently lags net income, that divergence is an early warning sign worth investigating.
Simplified financial statement example
| Line Item | Income Statement ($M) | Balance Sheet ($M) | Cash Flow Statement ($M) |
|---|---|---|---|
| Gross Profit | 200 | — | — |
| Net Income | 55 | — | — |
| Operating Cash Flow | — | — | 70 |
| Capital Expenditures | — | — | (20) |
Notice that net income is $55M but operating cash flow is $70M here, a healthy sign. When that relationship inverts, with net income above operating cash flow, it warrants closer scrutiny of working capital and accruals.
What are the key ratios and how do you calculate them?
Ratios compress the raw numbers from financial statements into comparable, interpretable signals. The table below covers the ratios most useful to individual investors, with formulas and a one-line interpretation for each.
| Ratio | Formula | What it tells you |
|---|---|---|
| EPS (Diluted) | Net Income ÷ Diluted Shares Outstanding | Earnings per share; rising EPS over time signals growing profitability |
| P/E Ratio | Market Price per Share ÷ EPS | How much the market pays per dollar of earnings; compare to sector median |
| P/B Ratio | Market Price per Share ÷ Book Value per Share | Premium or discount to net assets; low P/B can signal undervaluation in asset-heavy sectors |
| P/S Ratio | Market Cap ÷ Annual Revenue | Useful when earnings are negative; compare within sector |
| ROE | Net Income ÷ Shareholders’ Equity | Return generated on equity capital; above 15% is generally strong |
| ROIC | NOPAT ÷ Invested Capital | Efficiency of total capital deployment; above cost of capital creates value |
| Gross Margin | Gross Profit ÷ Revenue | Pricing power and production efficiency; expanding margin is a positive trend |
| Operating Margin | Operating Income ÷ Revenue | Core profitability before interest and taxes |
| Net Margin | Net Income ÷ Revenue | Bottom-line profitability after all expenses |
| Debt-to-Equity | Total Debt ÷ Shareholders’ Equity | Leverage; rising D/E with falling earnings is a red flag |
| Current Ratio | Current Assets ÷ Current Liabilities | Short-term liquidity; below 1.0 signals potential cash stress |
| Quick Ratio | (Current Assets – Inventory) ÷ Current Liabilities | Stricter liquidity test excluding inventory |
| Free Cash Flow | Operating Cash Flow – Capital Expenditures | Cash available after maintaining the asset base |
| Dividend Yield | Annual Dividend per Share ÷ Market Price per Share | Income return; sustainable only if FCF covers the payout |
Two short example calculations using illustrative numbers:
EPS and P/E: A company earns $200M in net income with 100M diluted shares outstanding. EPS = $200M ÷ 100M = $2.00. If the stock trades at $30, the P/E = $30 ÷ $2.00 = 15x. If the sector median P/E is 20x, the stock appears modestly undervalued on an earnings basis, though you would want to verify whether the earnings quality holds up.
Free cash flow: The same company reports $240M in operating cash flow and spends $60M on capital expenditures. FCF = $240M – $60M = $180M. FCF exceeds net income here, which is a positive quality signal: the business is converting more than 100% of its reported earnings into real cash.
How do you analyze a company’s fundamentals step by step?
A repeatable process matters more than any single ratio. The workflow below moves from a quick screen to a considered judgment, and it fits investors who have a few hours rather than a full research team.
-
Run a quick screen (15 minutes). Filter for basic thresholds: positive revenue growth over three years, positive operating cash flow, and a debt-to-equity ratio below your sector benchmark. This eliminates obvious mismatches before you spend time reading filings. Ask: does this business generate cash, and is it growing?
-
Read the latest 10-Q or 10-K highlights (30 minutes). Go to SEC EDGAR and pull the most recent annual or quarterly filing. Start with the MD&A (Management’s Discussion and Analysis) section, which explains results in plain language. Then check the critical accounting policies section for any changes that could affect comparability.
-
Build a three-to-five-year trend table (30–45 minutes). Pull revenue, gross margin, operating margin, EPS, and FCF for the past three to five years. Trends matter far more than any single period. Ask: are margins stable or expanding? Is EPS growing faster or slower than revenue? Is FCF tracking net income?
-
Assess cash flow quality (20 minutes). Compare operating cash flow to net income each year. Persistent divergence, where net income consistently exceeds operating cash flow, often signals aggressive revenue recognition or working capital deterioration. A healthy business converts most of its earnings into cash.
-
Benchmark against sector peers (20 minutes). A P/E of 25x means little in isolation. Compare it to the sector median and to the company’s own historical range. The same applies to margins and ROIC. Ask: is this company a leader, a laggard, or in line with peers?
-
Normalize for one-off items (15 minutes). GAAP accounting allows managerial discretion that can distort headline EPS. Remove restructuring charges, litigation settlements, asset write-downs, and unusual tax benefits to reveal the underlying run-rate earnings. This normalized EPS is what you should use in your valuation.
-
Assess qualitative factors (ongoing). Read the risk factors section of the 10-K. Evaluate management’s capital allocation history: do they invest in high-ROIC projects, or do they make dilutive acquisitions? Consider the competitive moat and whether the business model is durable. Corporate structure and reporting lines affect execution quality, and a company where organizational structure aligns with strategy tends to execute more consistently.
Pro Tip: When triaging red flags quickly, check the cash flow statement before the income statement. If operating cash flow is negative while net income is positive, that single data point should send you straight to the receivables and accruals footnotes before you read anything else.
How do fundamentals translate into a stock valuation?
Intrinsic value is the present value of all cash flows a business will generate over its lifetime, discounted back to today. Margin of safety is the gap between that intrinsic value and the current market price; buying at a meaningful discount to intrinsic value protects against forecast error and unforeseen events. Using multiple valuation approaches, combining relative multiples for market context with a DCF for a fundamentals-driven estimate, and then applying a margin of safety, produces more reliable conclusions than any single method alone.
Multiples-based valuation
Multiples are fast and grounded in market reality. The P/E ratio is the most common: if a company earns $3.00 per share and comparable companies trade at 18x earnings, a rough fair value estimate is $3.00 × 18 = $54.00 per share. EV/EBITDA is preferred for capital-intensive businesses or when comparing across different capital structures. P/S works when a company is pre-earnings but growing revenue rapidly.
The key discipline is picking the right peer group. A software company should not be benchmarked against an industrial manufacturer. Use sector medians from a financial data provider, and check whether the target company’s growth rate justifies a premium or discount to that median.
DCF valuation
A discounted cash flow model projects free cash flow over a forecast period, typically five to ten years, and discounts those cash flows back to present value using a discount rate that reflects the business’s risk. A terminal value captures the value of cash flows beyond the forecast window. The inputs that matter most are the near-term FCF growth rate, the discount rate (often the weighted average cost of capital, or WACC), and the terminal growth rate.
A simple conceptual example: a business generates substantial free cash flow today and projects steady growth over several years, with a modest terminal growth rate and discount rate applied. Running those assumptions through a DCF model produces an estimated intrinsic value. If the estimated intrinsic value exceeds the market cap by a meaningful margin, value investors might consider it a reasonable margin of safety. You can apply this logic directly using Tickerplace’s intrinsic value calculator without building a spreadsheet from scratch.
Pro Tip: Use multiples when the company has stable, positive earnings and clear comparable peers. Use a DCF when earnings are volatile, the company is in a high-growth phase, or you want to stress-test assumptions. When in doubt, run both and see whether they converge.
What are the signs of strong fundamentals and the red flags to avoid?
Strong fundamentals and warning signs rarely announce themselves clearly. Knowing what to look for in each direction saves time and prevents costly mistakes.
Signals of strong fundamentals
- Consistent revenue growth over three or more years, ideally accelerating rather than decelerating
- Rising free cash flow that tracks or exceeds net income growth
- Expanding gross and operating margins, which signal pricing power or improving efficiency
- ROIC consistently above the company’s cost of capital, indicating value creation
- Declining or stable debt-to-equity ratio, particularly when earnings are growing
- Management with a track record of high-ROIC capital allocation rather than dilutive acquisitions
Common red flags
- Declining revenue for two or more consecutive quarters without a clear cyclical explanation
- Persistent negative operating cash flow while net income remains positive
- Frequent one-off charges that recur year after year, suggesting they are not truly non-recurring
- Rising accounts receivable growing faster than revenue, which can signal aggressive revenue recognition
- Rapidly increasing debt without a corresponding improvement in earnings or cash flow
- Goodwill impairments or asset write-downs that suggest prior acquisitions were overpriced
Pro Tip: To confirm a red flag, reconcile GAAP net income to operating cash flow using the cash flow statement. A firm can report positive GAAP earnings but be burning cash due to receivables or heavy capex. If the gap between net income and operating cash flow has widened for three or more consecutive periods, treat it as a material concern, not a footnote.
Where do you find reliable company data for US-listed stocks?
The most authoritative source for any US-listed company is its own regulatory filings. Everything else, including financial data aggregators and research platforms, is derived from those primary documents.
Primary sources
SEC EDGAR (edgar.sec.gov) is the starting point. Every US public company files its annual report (10-K), quarterly report (10-Q), and material event disclosures (8-K) here. The 10-K is the most comprehensive document; the 10-Q updates key financials and MD&A each quarter. Primary filings should always be consulted for final verification before making investment decisions; aggregators can introduce errors or lag.
Investor relations pages on the company’s own website typically host earnings slides, press releases, and transcripts from earnings calls. These are often more readable than raw filings and highlight what management considers most important.
How to read a 10-K efficiently
- Start with Item 1 (Business): Understand what the company sells and who its customers are.
- Read Item 1A (Risk Factors): Look for risks that are specific and material, not boilerplate. New risks added year-over-year deserve attention.
- Go to Item 7 (MD&A): Management explains results, trends, and liquidity. This is where they discuss what drove revenue changes and what they expect ahead.
- Check Item 8 (Financial Statements and Notes): The notes contain critical accounting policies, segment results, and off-balance-sheet obligations.
- Scan for restatements: Any mention of a restatement or change in accounting policy in the notes or auditor’s report requires careful follow-up.
Pro Tip: Search the 10-K PDF for the word “restatement” and for phrases like “change in accounting estimate.” A single restatement is not automatically disqualifying, but a pattern of them signals that reported numbers are less reliable than they appear.
Financial data aggregators and screeners are useful for quickly pulling historical ratios and comparing peers, but always verify key figures against the primary filing before acting on them.
A short walkthrough: reading a company’s fundamentals
This is an illustrative example using hypothetical numbers. It is not investment advice and does not represent any real company.
Step 1: Quick screen. A hypothetical company, call it Company X, exhibits consistent revenue growth, positive operating cash flow, and a moderate debt load. It passes the initial filter.
Step 2: Ratio calculations.
- Net income and diluted shares allow for calculation of EPS.
- Market price combined with EPS yields a P/E ratio, which should be compared to sector medians to assess valuation.
- Operating cash flow and capital expenditures define free cash flow, which relative to net income can indicate earnings quality.
Step 3: Trend check. Over several years, revenue growth, stable or expanding margins, and EPS growth faster than revenue typically indicate improving operational efficiency and leverage.
Step 4: Normalize for one-offs. Adjusting for one-time charges helps reveal normalized earnings and adjusted valuation multiples that may differ significantly from headline figures.
Step 5: Peer comparison and judgment. At 15x adjusted earnings versus a sector median of 22x, with expanding margins and FCF matching net income, Company X appears undervalued on a relative basis. The margin of safety relative to a sector-median valuation is meaningful. A DCF using a 9% discount rate and 8% near-term FCF growth would likely confirm a fair value above the current market price, though the exact output depends on terminal growth assumptions.
Conclusion: The fundamentals are solid. The stock warrants deeper qualitative research, particularly on competitive positioning and management track record, before a final decision.
Disclaimer: this walkthrough uses illustrative numbers only and is not investment advice. Always consult primary filings and, where appropriate, a qualified financial professional before making investment decisions.
How Tickerplace converts fundamentals into fair-value estimates
Applying the steps above manually is instructive, but it is time-consuming at scale. Tickerplace automates the institutional-grade valuation process, covering 10,000+ US and ASX-listed equities with daily updated fair-value estimates built from the same multi-model framework described in this guide.
The workflow inside Tickerplace mirrors the analytical process directly. Enter a ticker and the platform surfaces standardized financials, including revenue trends, margin history, and cash flow data, so you can run the trend analysis from Step 3 in seconds rather than minutes. From there, the intrinsic value calculator applies DCF logic to the company’s financials, producing an intrinsic value estimate you can compare against the current market price. The stock valuation checker then gives you an immediate overvalued/undervalued signal based on P/E, P/S, and DCF models run in parallel.
For leverage checks, the debt-to-equity calculator lets you input balance sheet figures directly and benchmark the result. The margin of safety calculator quantifies the gap between your estimated intrinsic value and the market price, which is the final step in the valuation workflow covered in this guide.
Tickerplace’s core tools are free. The Pro upgrade unlocks full DCF breakdowns, scenario analysis, historical financials going back multiple years, and advanced screeners, features that are particularly useful once you move beyond a single-company analysis to comparing a sector or building a watchlist. Tickerplace is the publisher of this guide and the recommended platform for applying its methods.
Key Takeaways
Strong company fundamentals, read across all three financial statements and normalized for one-off items, give long-term investors the clearest available signal of whether a business is worth owning at its current price.
| Point | Details |
|---|---|
| Start with cash flow | Operating cash flow is the most reliable measure of business quality; always reconcile it to net income. |
| Trends beat snapshots | Analyze three to five years of revenue, margins, and EPS before drawing any conclusion from a single quarter. |
| Normalize before valuing | Remove restructuring charges, one-time gains, and unusual tax items from EPS before applying any valuation multiple. |
| Use margin of safety | Buy at a meaningful discount to intrinsic value to protect against forecast error and macro surprises. |
| Tickerplace applies the framework | Tickerplace’s free valuation tools, including DCF, P/E, and P/S models, convert the fundamentals in this guide into daily fair-value estimates for 10,000+ equities. |
The limits of fundamentals and where judgment takes over
Fundamentals are the most reliable framework available for evaluating a business, but they are not a complete picture. Forecasts embedded in a DCF model carry real uncertainty; a 1% change in the terminal growth rate assumption can shift the intrinsic value estimate by 20% or more. GAAP accounting gives management discretion over revenue recognition, depreciation schedules, and impairment timing, which means two companies with identical economic performance can report materially different earnings. Macro shocks, interest rate shifts, regulatory changes, and geopolitical events can alter a business’s trajectory in ways that no financial model anticipates.
Qualitative judgment fills those gaps. A company with mediocre financials but exceptional management and a widening moat may be a better long-term investment than a company with pristine numbers and a deteriorating competitive position. Understanding corporate governance and capital allocation history is a material part of qualitative analysis because it shapes how the business will perform in the next cycle, not just the last one.
The responsible approach combines rigorous fundamental analysis with portfolio-level risk management: diversify across sectors and business types, set position sizes that reflect your conviction and the uncertainty in your estimates, and revisit your thesis when new filings arrive. Fundamentals are a starting point for a decision, not a substitute for one.
This article is general educational information, not professional investment advice. Confirm current rules and figures with primary sources or a qualified financial professional before making investment decisions.
Tickerplace puts these tools in your hands for free
Reading financial statements and computing ratios manually is the right way to learn. Doing it for every stock on your watchlist is where most individual investors run out of time. Tickerplace closes that gap by delivering institutional-grade valuation outputs, DCF, P/E, and P/S models running simultaneously, for thousands of US-listed companies, updated every day.

The stock valuation calculator handles the relative and intrinsic valuation math covered in this guide. The stock intrinsic value checker gives you an immediate fair-value signal for any ticker, so you can screen a sector in minutes rather than hours. All core tools are free to use. Tickerplace Pro adds full DCF scenario analysis, extended historical financials, and advanced screeners for investors who want to go deeper. Start with the free valuation checker and see where your current holdings stand relative to their estimated fair value.
Useful sources and further reading
The resources below are the most authoritative places to continue your research, each serving a distinct purpose in the fundamental analysis process.
- SEC EDGAR: The primary source for all US public company filings, including 10-K annual reports, 10-Q quarterly reports, and 8-K material event disclosures. Always verify key figures here before acting.
- Investopedia: Financial Fundamentals Explained: The clearest publicly available primer on what fundamentals are, how to categorize them, and how they feed into valuation. Best for concept definitions and ratio explanations.
- Tickerplace: Apply the methods in this guide directly using free valuation calculators, daily fair-value estimates, and multi-model analysis across 10,000+ equities. Best for converting fundamentals into a quick overvalued/undervalued signal.
FAQ
How do you understand the fundamentals of a company?
Start with the three financial statements: the income statement for earnings and margins, the balance sheet for leverage and liquidity, and the cash flow statement for cash generation quality. Then compute key ratios such as EPS, P/E, and free cash flow, compare them to sector peers, and assess qualitative factors like management quality and competitive moat.
What are some examples of company fundamentals?
Core examples include revenue growth rate, earnings per share (EPS), free cash flow (FCF), gross and operating margins, return on equity (ROE), return on invested capital (ROIC), debt-to-equity ratio, and current ratio. Qualitative fundamentals include business model durability, management track record, and competitive positioning.
How can you tell if a company has good fundamentals?
A company with strong fundamentals typically shows consistent revenue and earnings growth over three or more years, free cash flow that tracks or exceeds net income, expanding margins, ROIC above its cost of capital, and a stable or declining debt load. Persistent divergence between net income and operating cash flow is one of the clearest early warning signs of deteriorating quality.
What does it mean if a company has strong fundamentals?
Strong fundamentals indicate that the business generates real cash, earns returns above its cost of capital, and is growing in a financially disciplined way. For investors, it means the stock’s price is more likely to reflect genuine business value over time rather than speculative sentiment, and that the company is better positioned to weather economic downturns.
Can Tickerplace help me apply fundamental analysis?
Tickerplace automates the valuation step by running DCF, P/E, and P/S models simultaneously for 10,000+ US and ASX-listed equities, producing daily intrinsic value estimates and fair-value signals. Free tools include the intrinsic value calculator and stock valuation checker; Tickerplace Pro adds full DCF scenario analysis and extended historical financials.