
6 Stock Price Assessment Steps for Individual Investors

TL;DR:
- Assessing a stock price involves six systematic steps, from defining objectives to establishing buy, hold, or sell rules.
- Gathering primary data from SEC filings and analyzing business and industry fundamentals are crucial before calculating ratios or valuations.
- Using multiple valuation methods and applying a margin of safety helps make informed investment decisions amid market uncertainties.
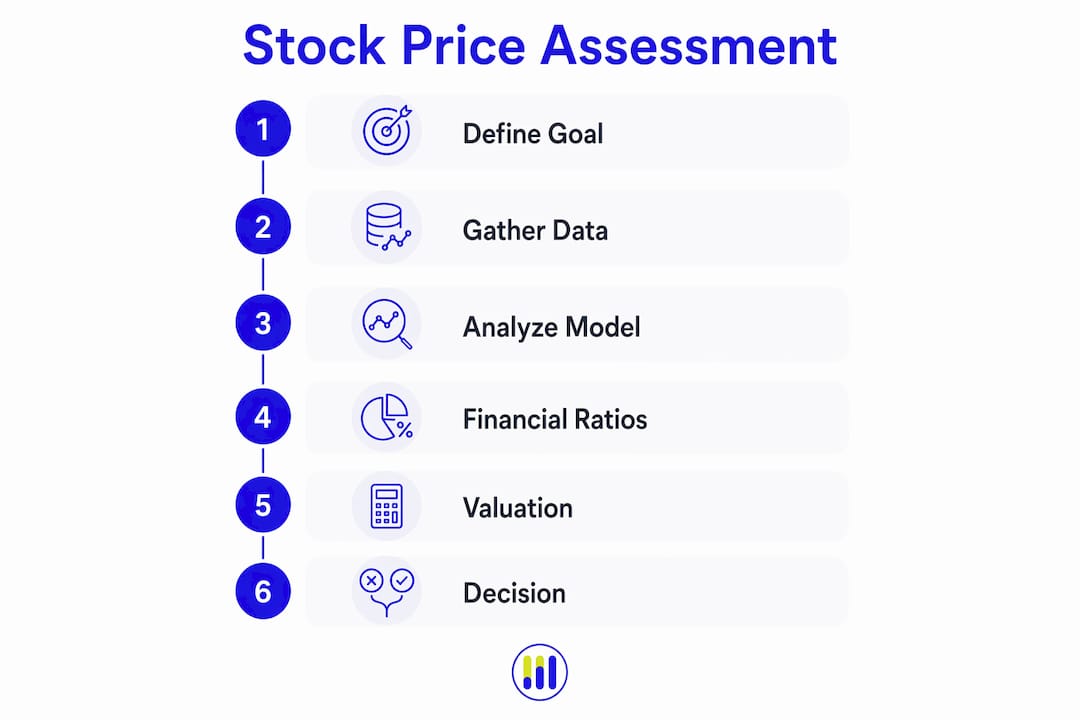
Assessing a stock price comes down to six repeatable steps: (1) define your investing goal, time horizon, and risk tolerance; (2) gather primary data from SEC filings, earnings releases, and macro inputs; (3) analyze the business model, industry position, and management quality; (4) compute key financial ratios from the income statement, balance sheet, and cash flow statement; (5) value the business using multiple methods to build a range; and (6) convert that range into a buy/hold/sell decision with clear position-sizing and monitoring rules. These stock price assessment steps follow the fundamental analysis framework that moves from macro context down to intrinsic valuation. Pull up the company’s latest 10-K right now and work through each step below — every section includes decision rules, worked examples, and tools to speed up the process.
Table of Contents
- What are the stock price assessment steps you should follow?
- Step 2 — what data do you need before you start?
- Step 3 — how do you analyze the business model and industry position?
- Step 4 — which financial ratios tell you the most about a stock?
- Step 5 — how do you value a stock using multiple methods?
- Step 6 — how do you turn a valuation into a buy, hold, or sell decision?
- Short-term drivers: when do technicals and sentiment actually matter?
- How do Tickerplace tools speed up each assessment step?
- Key Takeaways
- The case for process over prediction
- Tickerplace gives you institutional-grade valuation tools for free
- Primary sources and further reading
- FAQ
What are the stock price assessment steps you should follow?
Before running a single ratio, you need a clear investing goal. The yardstick you apply to a stock depends entirely on why you are buying it and how long you plan to hold it.
Goals shape acceptable multiples. An income investor targeting dividend yield will tolerate a lower P/E than a growth investor expecting 20% annual revenue expansion. A speculative position in an early-stage biotech demands a different margin of safety than a blue-chip holding. Knowing which category applies prevents you from comparing apples to aircraft carriers.
Time horizon determines which metrics matter most:
- Short term (under 12 months): Price momentum, near-term earnings catalysts, and relative valuation multiples carry the most weight.
- Medium term (1–3 years): Revenue growth trajectory, margin expansion, and free cash flow conversion become central.
- Long term (3+ years): Discounted cash flow analysis, competitive moat durability, and capital allocation track record are the primary inputs.
Risk tolerance sets position size. A high-conviction, well-researched position in a company you understand deeply can justify 5–8% of a diversified portfolio. A speculative or early-stage holding rarely warrants more than 1–2%. Diversification across sectors reduces the damage any single misjudgment can cause.
Pro Tip: Match your valuation method to your horizon. DCF models reward patience and suit long-term investors; price-to-earnings or EV/EBITDA comparables give faster reads for medium-term checks. Using a DCF to justify a three-month trade is a mismatch that inflates your confidence.
Step 2 — what data do you need before you start?
A stock price evaluation process built on incomplete data produces unreliable conclusions. The goal here is to assemble a fact base before touching a single ratio or valuation model.
Primary company documents to pull:
- Latest annual report (SEC 10-K filing): business overview, risk factors, audited financials, and management discussion
- Most recent quarterly report (10-Q): updated revenue, margins, and balance sheet
- Recent earnings releases and earnings call transcripts: management tone, guidance revisions, and analyst Q&A
- Investor presentations and capital markets day decks: long-term targets and strategic priorities
- Proxy statement (DEF 14A): executive compensation structure and board composition
Macro and industry inputs to track:
- Federal Reserve interest rate decisions and the current yield curve shape
- Inflation data (CPI, PPI) and GDP growth trend
- Sector-specific indicators: housing starts for homebuilders, rig counts for energy, same-store sales for retail
- Competitor earnings releases, which often reveal industry-wide pricing or demand trends
Data points to record for ratio and valuation work:
- Revenue (last 3–5 years), net income, operating income, and EBITDA
- Operating cash flow and free cash flow (operating cash flow minus capital expenditures)
- Total debt, cash and equivalents, and shares outstanding
- Management’s forward guidance for revenue and earnings per share
Save direct links to each SEC filing and note the date you pulled the data. Valuations shift when inputs change, and an audit trail lets you identify exactly what changed during a re-evaluation.
Step 3 — how do you analyze the business model and industry position?
Financial ratios only make sense when you understand what the business actually does. This step translates qualitative facts into the hypotheses that will drive your valuation assumptions.

Mapping the business model starts with three questions: Where does revenue come from? How sticky are customers? Does the company have pricing power? A software company with 90% recurring subscription revenue and high switching costs carries a fundamentally different risk profile than a commodity manufacturer selling on spot prices.
Industry analysis should cover the competitive structure (fragmented vs. oligopoly), whether growth is cyclical or secular, and the regulatory environment. A company operating in a regulated utility sector faces different valuation logic than a consumer discretionary brand exposed to economic cycles.
Management quality and governance are often underweighted. Look at the consistency of capital allocation decisions over 5–10 years: did management buy back stock at sensible prices, or did they overpay at cycle peaks? Check insider ownership levels — executives with meaningful personal stakes tend to make more shareholder-aligned decisions. Review related-party transactions in the proxy statement for conflicts of interest.
Red flags that should slow or stop an assessment:
- Frequent restatements of prior-period financials
- Opaque or inconsistent segment reporting that obscures true profitability
- Rapid management turnover, especially at the CFO level
- Revenue growth driven entirely by acquisitions with no organic component
- Debt levels rising faster than cash flow generation
Any one of these warrants deeper scrutiny before proceeding to valuation.
Step 4 — which financial ratios tell you the most about a stock?
Key valuation ratios — P/E, P/S, and debt-to-equity — are derived directly from 10-K and 10-Q filings, which makes them verifiable and comparable across periods. The table below shows the core ratios, their formulas, and what each one actually measures.

| Ratio | Formula | What it tells you |
|---|---|---|
| Price-to-Earnings (P/E) | Share price ÷ EPS | How much the market pays per dollar of earnings |
| Price-to-Sales (P/S) | Market cap ÷ annual revenue | Useful when earnings are negative or distorted |
| EV/EBITDA | Enterprise value ÷ EBITDA | Capital-structure-neutral profitability comparison |
| Debt-to-Equity (D/E) | Total debt ÷ shareholders’ equity | Leverage and financial risk |
| Return on Equity (ROE) | Net income ÷ shareholders’ equity | Management’s efficiency in generating profit from equity |
| Free Cash Flow per share | (Operating CF – CapEx) ÷ shares outstanding | Cash the business actually generates for shareholders |
| Gross margin | Gross profit ÷ revenue | Pricing power and cost structure |
Worked example (hypothetical): Suppose a company reports $4.00 in earnings per share, trades at $60, and carries $500M in debt against $1B in equity. Its P/E, D/E ratio, and price-to-free-cash-flow can be calculated from the financial data, providing insight into valuation and leverage. Cross-referencing these against industry peers immediately shows whether the stock is priced at a premium or discount to comparable businesses.
Normalizing earnings matters. Cyclical businesses and companies with large one-time items (asset sales, restructuring charges, litigation settlements) will show distorted ratios in any single year. Use a 3–5 year average of earnings or EBITDA to smooth out the noise before drawing conclusions. For a deeper walkthrough of ratio-based stock evaluation, the process follows the same multiyear trend logic.
Pro Tip: For capital-intensive industries like manufacturing or telecom, EV/EBITDA is a cleaner comparison than P/E because it strips out the distorting effects of different depreciation policies and debt levels across peers.
Step 5 — how do you value a stock using multiple methods?
No single valuation method is universally best; combining absolute models with relative multiples produces a more reliable range than any one approach alone. The standard practice is to run two or three methods, note where they converge, and treat divergence as a signal to investigate further.
Absolute vs. relative models:
- Absolute models (DCF, Dividend Discount Model): estimate intrinsic value from the company’s own cash flows or dividends, discounted at a rate that reflects risk. Best for stable, cash-generative businesses with predictable growth.
- Relative models (P/E comparables, EV/EBITDA multiples): benchmark the stock against peers. Faster to run but dependent on selecting truly comparable firms — a common source of error when peers differ in capital intensity or growth profile.
DCF overview: Project free cash flow for 5–10 years using your revenue and margin assumptions, apply a discount rate (typically the weighted average cost of capital), and add a terminal value. The terminal value usually represents the majority of the total DCF output, which means your long-term growth assumption is the single most sensitive input.
Sensitivity table — DCF valuation range (hypothetical):
| Discount rate | 2% terminal growth | 3% terminal growth | 4% terminal growth |
|---|---|---|---|
| 10% | $58 | — | $79 |
Shifts in discount rates or terminal growth rates significantly impact the implied value, which is why a point estimate from a single DCF can be misleading. For a practical guide to running these calculations, the intrinsic value calculator guide covers DCF inputs and limitations in detail.
Building a valuation range: Take the midpoint outputs from your DCF and your comparables analysis. If the DCF suggests $58–$79 and the comparables suggest $62–$74, the overlap zone ($62–$74) is your central estimate. A stock trading at $50 against that range offers a margin of safety; one trading at $90 is priced for perfection.
Margin of safety rule of thumb: Many value investors require a 20–30% discount to their central estimate before buying. The exact threshold should reflect your confidence in the inputs — a highly uncertain DCF warrants a wider buffer than a comparables analysis on a stable, well-covered business.
Step 6 — how do you turn a valuation into a buy, hold, or sell decision?
Valuation without a decision framework is just math. The goal of this step is to convert your valuation range into a concrete action with defined position sizing and a monitoring plan.
Decision rules based on valuation range:
-
Buy: Current price is at least 20–30% below your central valuation estimate, fundamentals are intact, and the thesis is clear.
-
Hold: Price is within your valuation range; no material change to the thesis. Continue monitoring.
-
Reduce or sell: Price has exceeded your central estimate by 15–20% or more, or the investment thesis has changed (earnings miss, guidance cut, competitive disruption).
-
Avoid: Valuation is stretched, margin of safety is absent, and the business model shows red flags from Step 3.
Position sizing tied to conviction:
- High conviction, well-understood business: a meaningful portion of your portfolio
- Moderate conviction or higher uncertainty: a moderate portion
- Speculative or early-stage: a small portion
Use a stock profit/loss calculator to model the dollar impact of different entry prices and position sizes before committing capital.
Monitoring plan — triggers for a full re-assessment:
- Quarterly earnings release with a revenue or EPS miss greater than 5% versus guidance
- Management guidance revision downward by more than 10%
- Material M&A announcement (acquisition or divestiture above 10% of market cap)
- Significant change in the competitive environment (new entrant, pricing war, regulatory shift)
- Interest rate move of 100 basis points or more that materially affects the discount rate
Pro Tip: Avoid using hard stop-losses as a substitute for fundamental re-evaluation. A 15% price decline in a stock you understand deeply may be a buying opportunity, not an exit signal. Set calendar reminders to re-read the thesis after each quarterly filing instead of reacting to daily price moves.
Short-term drivers: when do technicals and sentiment actually matter?
Fundamentals drive long-term value, but prices can disconnect from intrinsic estimates for months or even years due to sentiment, momentum, and macro shocks. Understanding this gap helps you use short-term signals correctly — as timing or confirmation tools, not as valuation inputs.
Technical indicators worth checking before entry:
- 50-day and 200-day simple moving averages: A stock trading well below both often signals near-term selling pressure; a recent “golden cross” (50-day crossing above 200-day) can confirm improving momentum.
- Volume spikes on price moves: High volume on a breakout adds conviction; high volume on a decline may signal institutional selling.
- Relative strength vs. sector: A stock underperforming its sector for 3–6 months while fundamentals are intact may be approaching a re-rating opportunity.
Interest rate changes act as a gravity force on valuations: rising rates raise discount rates in DCF models and make fixed-income alternatives more attractive, compressing multiples across the market. This is a macro input to your valuation, not just a sentiment signal.
When technicals should override valuation:
- A trading halt or liquidity crisis (bid-ask spreads widen dramatically, volume collapses)
- A company under active regulatory investigation with undisclosed financial exposure
- Evidence of fraud or accounting irregularities surfacing in real time
- A sector-wide credit event (e.g., a banking crisis) that changes the cost of capital overnight
Outside these scenarios, use technicals to stagger your entry across 2–3 tranches rather than to change your fundamental view.
How do Tickerplace tools speed up each assessment step?
Working through six steps manually — pulling filings, computing ratios, building a DCF, running sensitivity tables — takes hours. Tickerplace provides free, pre-built calculators that map directly to the steps above, reducing arithmetic errors and letting you focus on the judgment calls.
Which tools match which steps:
- Step 4 (ratios): The debt-to-equity calculator and enterprise value calculator take inputs directly from the balance sheet figures you recorded in Step 2.
- Step 5 (valuation): The intrinsic value calculator runs a DCF-style model; the stock valuation calculator applies P/E and P/S models side by side, generating a multi-model valuation range in one view.
- Step 6 (decision and sizing): The stock average price calculator helps model cost-basis scenarios when averaging into a position across tranches.
Short walkthrough: Enter the free cash flow per share, expected growth rate, and discount rate from your Step 2 data into the intrinsic value calculator. The tool returns a DCF-based fair value estimate. Then open the stock valuation calculator, enter the current P/E and the sector average P/E, and compare the relative valuation output to the DCF result. Where both methods converge, your confidence in the range increases.
Tickerplace covers 10,000+ US and ASX-listed equities, with valuations updated daily, so the ratio and valuation data is current without requiring manual recalculation after each earnings release. For a broader introduction to the methodology behind these tools, the fundamental analysis primer at Olla Trade provides useful context on how absolute and relative models fit together.
Pro Tip: After running the calculators, save a screenshot of the inputs and outputs with the date. When you re-evaluate after the next earnings release, comparing the new outputs to your saved baseline shows exactly which assumption changed and by how much — a discipline that prevents hindsight bias from distorting your re-assessment.
Always verify the inputs you enter against the primary SEC filings. Calculator outputs are only as reliable as the assumptions behind them.
Key Takeaways
A disciplined stock price assessment requires six sequential steps — from defining your goal and gathering primary data through to building a valuation range and setting clear buy/hold/sell rules — applied consistently across every position.
| Point | Details |
|---|---|
| Start with goals and horizon | Your time horizon determines which valuation method is appropriate; DCF suits long-term holds, comparables suit medium-term checks. |
| Use primary SEC filings | Pull the 10-K and 10-Q directly from SEC EDGAR for audited, verifiable financial data before computing any ratio. |
| Normalize earnings | Use a 3–5 year average for cyclical businesses and strip out one-time items before applying P/E or EV/EBITDA multiples. |
| Combine valuation methods | Run DCF and relative multiples together; the overlap zone between both outputs is your most defensible valuation range. |
| Set a margin of safety | Require a 20–30% discount to your central estimate before buying; widen the buffer when your DCF inputs carry high uncertainty. |
| Use Tickerplace calculators | The intrinsic value, stock valuation, and debt-to-equity calculators map directly to Steps 4–6, reducing errors and saving time. |
The case for process over prediction
The most common mistake individual investors make is treating stock assessment as a search for the right answer rather than a process for making better decisions under uncertainty. A DCF model built on reasonable assumptions will still be wrong — terminal growth rates are inherently unknowable, and competitive dynamics shift. What the process gives you is not certainty; it gives you a structured way to identify when the market’s implied assumptions are disconnected from what the business can realistically deliver.
Behavioral biases are the silent saboteur of even technically sound assessments. Anchoring to a purchase price distorts sell decisions. Confirmation bias leads investors to weight positive news more heavily after they have already bought. Recency bias causes overreaction to the most recent quarter’s results, treating a single miss as a thesis-breaker when the long-term picture is unchanged. The six-step framework described here is partly a discipline against these tendencies: by requiring you to document assumptions before buying and re-evaluate against those same assumptions after each earnings release, it creates a paper trail that makes bias visible.
Short-term price noise is not the enemy of good investing. The real risk is confusing noise for signal. A stock that drops 20% on a market-wide selloff while its fundamentals remain intact is not a worse investment than it was before the decline — it is a cheaper one. Keeping that distinction clear, consistently, is what separates a repeatable assessment process from reactive decision-making.
Tickerplace gives you institutional-grade valuation tools for free
Running all six assessment steps manually is time-consuming, and arithmetic errors in a DCF can shift your implied value by tens of percentage points. Tickerplace eliminates that friction. The platform provides multi-model valuation — DCF, P/E, and P/S analysis — for 10,000+ US and ASX-listed equities, updated daily, at no cost.

The stock valuation checker gives you an immediate overvalued/undervalued read on any covered stock, while the intrinsic value calculator lets you input your own growth and discount rate assumptions to build a personalized valuation range. Both tools return sensitivity outputs so you can see how the fair value estimate shifts under different scenarios — the same analysis that would take hours in a spreadsheet, completed in minutes. Enter the ticker, check the inputs against your Step 2 data, and you have a defensible starting point for your buy/hold/sell decision. Always verify the assumptions before acting on any output.
This article is for general informational purposes only and does not constitute investment advice. Confirm current figures and consult a qualified financial professional before making investment decisions.
Primary sources and further reading
The sources below are the primary references used in this article and the most useful starting points for further research:
- Evaluating Stocks — FINRA: FINRA’s investor guidance on reading 10-K and 10-Q filings and interpreting key ratios
- SEC EDGAR full-text search: the primary source for all company 10-K and 10-Q filings
- Choosing Valuation Methods — Investopedia: explanation of DCF, DDM, and comparable multiples with guidance on when to use each
- Stock Valuation Techniques — Corporate Finance Institute: detailed breakdown of comparable company analysis and common pitfalls
- Factors That Move Stock Prices — Investopedia: overview of fundamental vs. technical drivers of short- and long-term price movement
- What Causes Share Prices to Change — IG: interest rate effects and macro drivers of valuation compression
- SIPC Investor Protection: background on brokerage account protections relevant to U.S. investors
- BrokerCheck — FINRA: tool for verifying the registration and disciplinary history of brokers and advisors
FAQ
How do you assess a stock’s price in six steps?
Define your goal and risk tolerance, gather primary data from SEC filings, analyze the business model and industry position, compute key ratios (P/E, D/E, ROE, free cash flow), run DCF and relative valuation models to build a range, then set buy/hold/sell rules with a margin of safety of 20–30% below your central estimate.
What is the 3-5-7 rule in stocks?
Position sizing should limit risk sensibly at multiple levels, such as per trade, per sector, and across the portfolio; these guidelines vary by investor and risk tolerance and serve as heuristics rather than fixed regulatory standards.
How do you analyze a stock using fundamental analysis?
Fundamental analysis moves from macro context to intrinsic valuation: assess the economic environment and industry structure, review the business model and management quality, read the financial statements, compute key ratios, and estimate intrinsic value using DCF and relative multiples.
Which valuation method is most reliable for individual investors?
No single method is universally best; combining absolute models like DCF with relative multiples such as P/E or EV/EBITDA produces a more reliable range than any one approach alone, and the overlap between methods is your most defensible estimate.
Why do stock prices fluctuate even when fundamentals are unchanged?
Short-term price moves are driven by market sentiment, technical momentum, and macro events like interest rate changes, which can temporarily disconnect price from intrinsic value; over the long term, earnings growth and valuation multiples are the primary determinants of where a stock trades.