
Investors: Test Valuations With Equity Risk Premium (4%–6%)

The equity risk premium (ERP) is the extra return investors demand for holding stocks instead of a risk-free asset like a government bond. It shows up directly in the CAPM formula as (Rm − Rf), and it drives the discount rate in every DCF valuation. Analysts estimate it three ways: historical averages, investor surveys, and implied (market-derived) models.
TL;DR:
- Implied ERP generally provides a more current and market-sensitive estimate than historical averages, especially when market conditions are stable and data is reliable.
- The country risk premium adds specific risk adjustments for emerging or less stable markets, based on sovereign spreads and company revenue exposure to those regions.
- Sensitivity testing with different growth assumptions is crucial, as a one percentage point change in the long-term growth rate can alter the implied ERP by more than one percentage point.
- Short-term, option-implied ERP estimates reflect near-term sentiment but can be volatile, while long-term estimates remain more stable but may lag behind structural shifts.
- Applying a single, uniform ERP across diversified portfolios or different sectors leads to mispricing; asset-specific factors like size, sector, and market liquidity matter significantly.
What Is the Equity Risk Premium and Why Does It Matter?
The equity risk premium is the risk-free rate plus a premium investors need to accept for the uncertainty of stock ownership. That structure shows up explicitly in the Capital Asset Pricing Model: Re = Rf + β(Rm − Rf), where Re is the cost of equity, Rf is the risk-free rate, β measures a stock’s sensitivity to market swings, and (Rm − Rf) is the ERP itself.
The intuition is simple even when the math looks dense. Stocks carry no guaranteed payoff, so investors as a group demand compensation for that uncertainty. The size of that demand shifts with collective risk aversion. During calm markets, the premium investors require tends to shrink. During a downturn or a period of high uncertainty, it widens because investors want more compensation to hold onto risky assets.
That shift matters enormously for valuation. Raise the ERP by even one percentage point, and the discount rate in a DCF model climbs, which pushes the present value of future cash flows down.
A few consequences follow directly from this mechanic:
- Higher ERP assumptions lower intrinsic value estimates across nearly every DCF-based model.
- Lower ERP assumptions justify higher valuation multiples, which is part of why bull markets often coincide with falling implied premiums.
- In rare, extreme optimism scenarios, the implied ERP can turn negative, signaling that investors expect stocks to underperform bonds. That is a warning sign worth taking seriously rather than dismissing as a modeling glitch.
Historical, Survey, or Implied: Which ERP Method Should You Use?
Three estimation methods dominate practice, and each answers a slightly different question. Damodaran’s research walks through all three in detail, and most valuation disagreements trace back to which one an analyst picked.
- Historical ERP looks backward. You pick a sample period (often post 1928, or a shorter post war window), calculate average stock returns and average bond returns over that period, then subtract. The catch is that arithmetic averages and geometric averages produce different answers. Arithmetic means tend to run higher because they don’t compound compounding effects out, while geometric means better reflect what a buy-and-hold investor actually earned. Sample choice matters just as much. A period starting in a bull market will show a smaller premium than one starting during a crash.
- Survey-based ERP polls investors, CFOs, or academics about their return expectations and derives the premium from their collective forecast. It’s forward-looking by design, which is an advantage over pure historical data. The downside is that survey respondents anchor heavily on recent performance, so their forecasts often just extrapolate whatever happened over the last few years rather than reflecting a genuinely independent view.
- Implied ERP works from current market prices. You take the current index level, estimate the cash flows shareholders expect (dividends or free cash flow to equity), assume a long-term growth rate, and solve for the discount rate that makes the present value of those cash flows equal the current price. Subtract the risk-free rate from that discount rate and you have the implied ERP. Because it uses today’s prices, this method reacts immediately to market sentiment and doesn’t depend on which historical window you happened to choose.
Pro Tip: Run the implied ERP calculation with two or three different growth assumptions before you trust the output. A half-point change in your long-term growth rate can move the implied premium by more than a full percentage point, so treat the result as a range, not a single precise number.
Damodaran’s own view, echoed across his ERP research, is that implied estimates are usually preferable to historical averages once you have reliable market data, precisely because history can mislead badly in markets that haven’t behaved consistently over time. Historical averages still earn their place in classroom settings and quick back-of-envelope checks, but professional valuation work increasingly leans on the implied approach as the primary input, with historical and survey figures used as sanity checks.
How Do You Calculate a Country Risk Premium?
A mature-market ERP, typically built from U.S. data, understates the risk of investing in markets with weaker institutions, less liquid currencies, or higher default risk. The country risk premium (CRP) fills that gap by adding a country-specific layer on top of the base ERP.
Damodaran’s country default spread tables offer the most widely used framework for this adjustment, built around three approaches:
- Default spread method: take the spread between a country’s sovereign bond yield and a comparable U.S. Treasury yield, and add it directly to the mature-market ERP.
- Volatility multiplier method: scale that default spread by the ratio of equity market volatility to bond market volatility in that country, since equities are typically riskier than sovereign debt.
- Melded approach: blend CDS spreads with equity volatility data to smooth out distortions from illiquid bond markets.
Applying CRP at the company level takes one more step. Instead of adding the full country premium to every firm operating in that market, analysts estimate a lambda, an exposure factor based on how much of a company’s revenue actually comes from the risky country. Skipping that adjustment is one of the more common valuation mistakes, and it tends to overstate risk for globally diversified companies while understating it for purely domestic ones.
Worked Examples: Calculating Historical and Implied ERP
Historical and implied ERP calculations use different inputs entirely, so walking through both side by side shows why they rarely land on the same number.
- Historical ERP. Suppose you select a multi-decade sample and find that stocks returned an arithmetic average of 11.5% annually while government bonds returned 5.2%. That produces a historical ERP of roughly 6.3 percentage points. Switch to geometric averages on the same data, and the stock return might compress to around 9.5%, narrowing the ERP to about 4.3 points. The method you choose swings the answer by two full percentage points on identical raw data.
- Implied ERP. Start with the index dividend yield (say 1.8%), add an assumed long-term earnings and dividend growth rate (say 5%), and you get an implied required return of roughly 6.8%. Subtract a risk-free rate of 4.2% and the implied ERP comes out near 2.6 percentage points, well below the historical arithmetic figure.
The gap between those two answers is exactly why sensitivity testing matters:
A one-point change in the growth assumption moves the implied ERP by a full percentage point. That is not a rounding error, it’s the entire ballgame in a DCF model. Readers can reproduce both calculations, and see how the resulting ERP feeds into a full valuation, using the intrinsic value calculator and stock valuation calculator.
How Should You Choose an ERP for Your Own Valuation Work?
Picking an ERP isn’t a one-size-fits-all decision. It depends on what you’re building and how much precision the task demands.
Start with purpose. A quick screening exercise across dozens of stocks can tolerate a standard, market-wide ERP assumption. A deep, single-company valuation you plan to act on with real money deserves a more careful, implied estimate tailored to current conditions. Time horizon matters too: a short-term trading model might lean on option-implied signals, while a long-term retirement portfolio decision is better served by a blended historical and implied view.
A few practical defaults help keep assumptions grounded:
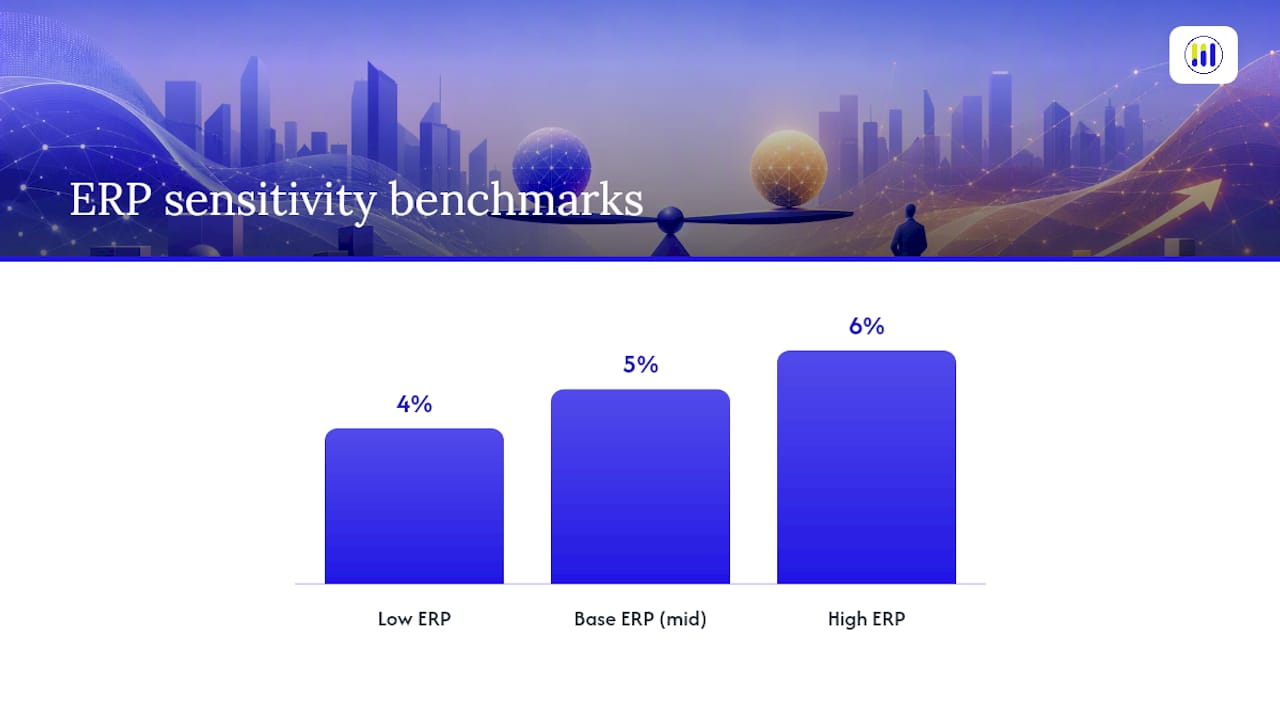
- For mature markets like the U.S. or Australia, a conservative ERP range typically sits between 4% and 6%, though implied estimates can move outside that band during market stress.
- Favor implied ERP when current market data is reliable and liquid; fall back to historical averages when implied inputs are noisy or unavailable.
- Always document your ERP assumption explicitly in any valuation write-up. A number buried in a spreadsheet without context is a liability, not an input.
- Run at least a three-point sensitivity table (low, base, high ERP) so you can see how much of your valuation conclusion depends on that single assumption.
Pro Tip: If your valuation conclusion flips between “undervalued” and “overvalued” within a plausible ERP range, that’s not a data problem, it’s information. It tells you the stock’s mispricing case is thin and depends heavily on an assumption nobody can pin down precisely.
The most common mistake in practice isn’t picking the “wrong” ERP, it’s picking one number and never testing how fragile the conclusion is around it. Analysts who present a single fair value estimate without a sensitivity range are implicitly claiming a precision the underlying method simply doesn’t support, since ERP estimates vary meaningfully by method and input choice even among practitioners using the same data.
Applying ERP With Tickerplace’s Valuation Tools
Turning ERP theory into a usable valuation takes a repeatable workflow, not a one-off spreadsheet you rebuild every time.
- Gather inputs: risk-free rate, dividend or FCFE data, and a growth assumption for an implied estimate, or historical return series for a historical one.
- Choose your method: implied for current, market-driven views; historical for long-term baseline checks.
- Run scenarios: test low, base, and high ERP assumptions to see how sensitive your fair value estimate is.
- Apply it in a DCF: feed the resulting cost of equity into a full valuation model.
Tickerplace’s intrinsic value calculator handles that last step directly, letting you adjust discount rate assumptions and see the fair value estimate update in real time. The stock valuation checker then compares that output against the current market price, showing whether your ERP assumption implies the stock is overvalued or undervalued right now. With daily-updated valuations across many U.S. and ASX listed companies, a platform can provide a consistent baseline to test ERP sensitivity without rebuilding a model from scratch for every ticker.
What Drives the Equity Risk Premium?
Three forces shape the size of the equity risk premium at any given time, and they rarely move in the same direction at once.
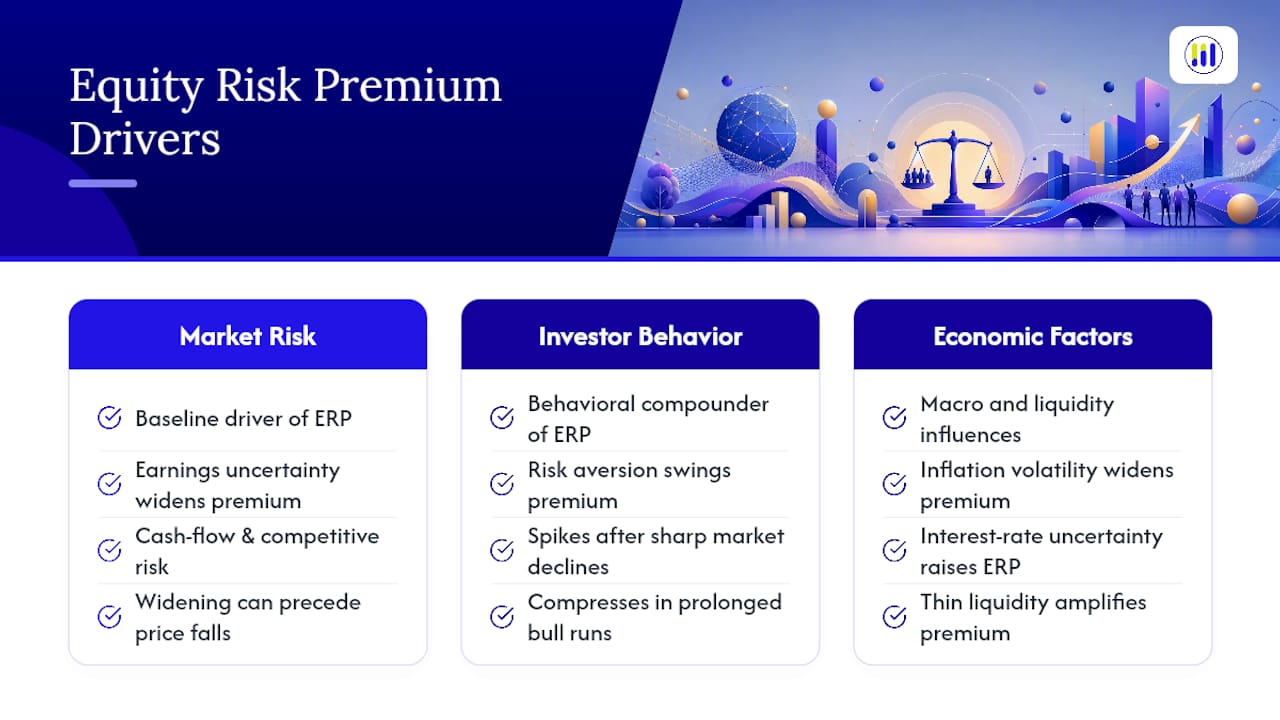
Market risk is the baseline driver. Equities carry earnings uncertainty, competitive risk, and cash flow variability that bonds simply don’t, and investors price that gap into required returns. When earnings visibility drops across an economy, the premium investors demand tends to widen even if stock prices haven’t fallen yet.
Investor behavior compounds that baseline. Risk aversion isn’t constant. It swings with sentiment, recent losses, and herd behavior. After a sharp market decline, investors often demand a noticeably higher premium for the next dollar invested, which is part of why ERP tends to spike during crises and compress during prolonged bull runs. That’s a behavioral pattern, not a rational recalibration of fundamental risk.
Economic factors round out the picture. Inflation volatility, interest rate uncertainty, and GDP growth expectations all feed into how investors price equity risk. A period of unstable inflation makes future cash flows harder to forecast, which pushes the premium higher independent of any change in company fundamentals. Liquidity conditions matter as well. Thinner trading volumes and wider bid ask spreads during stress periods amplify the premium further, since investors demand extra compensation for the risk of not being able to exit a position cleanly.
None of these drivers operates in isolation, which is exactly why a single ERP number, however carefully calculated, is always an approximation of a moving target.
Does Your Time Horizon Change Your ERP Estimate?
Yes, and the effect is larger than most investors expect. Short-horizon and long-horizon ERP estimates answer genuinely different questions, and conflating them is a frequent source of valuation error.
Option-implied ERP measures, drawn from current derivatives pricing, reflect what the market expects over the next few months to a couple of years. They react quickly to news, earnings surprises, and shifts in monetary policy. That responsiveness makes them useful for tactical decisions but noisy for anything long-term, since a single macro surprise can swing a short-horizon estimate meaningfully within weeks.
Long-horizon estimates, whether historical averages or CAPE-based implied figures, smooth over that noise by design. They’re built to represent a multi-decade expectation, which makes them far more stable but also slower to reflect genuine shifts in the investment environment. A long-term investor building a retirement plan should generally anchor to a long-horizon estimate rather than chasing whatever a short-term option-implied number says this quarter. A trader positioning for the next earnings cycle needs the opposite. Mixing the two, using a short-horizon figure to justify a decade-long holding decision, is one of the more subtle but consequential mistakes investors make when they encounter ERP data without understanding its time frame.
How Does the Equity Risk Premium Differ Across Markets and Assets?
The mature-market ERP that anchors most U.S. valuation models doesn’t transfer cleanly to other markets or asset classes, and treating it as universal is a common source of mispricing.
Emerging markets typically carry a materially higher premium than developed markets like the U.S. or Australia, reflecting weaker institutions, currency risk, and less predictable earnings. That gap is exactly what the country risk premium framework exists to quantify, layering a country-specific spread on top of the mature-market baseline rather than assuming one global number fits every equity market.
Asset classes diverge just as sharply. Small cap stocks tend to carry a higher implied premium than large cap stocks, since they’re more volatile and less liquid, a pattern long documented in size-premium research separate from the core ERP literature. Real estate investment trusts and other yield-heavy asset classes often price closer to a blended bond-equity premium, since their cash flows behave more like fixed income in stable periods. Even within equities, sector matters. Cyclical sectors like energy and materials typically demand a higher premium than defensive sectors like utilities and consumer staples, because their earnings swing harder with the economic cycle.
The practical takeaway is straightforward: a single ERP figure applied uniformly across a diversified global portfolio, or across large cap and small cap holdings alike, will systematically misprice at least some of those positions.
How Do ERP Shifts Affect Portfolio Allocation?
A rising or falling equity risk premium doesn’t just move individual stock valuations, it changes the calculus behind how much of a portfolio should sit in equities versus bonds or cash in the first place.
When the ERP widens, whether from a market shock, rising inflation uncertainty, or a general spike in risk aversion, stocks become theoretically more attractive relative to bonds on a forward-looking basis, even as near-term prices fall. That’s the counterintuitive part: a widening premium often coincides with falling prices, which is precisely when long-term investors are compensated for taking on equity risk that others are currently shunning. Investors who understand this dynamic tend to view a spike in implied ERP as a signal to hold steady, or even add to equity positions, rather than retreat.
The reverse holds when the ERP compresses. A narrow premium means investors are accepting less compensation for equity risk relative to history, often a sign that valuations have run ahead of fundamentals. That’s typically when a disciplined allocation strategy calls for trimming equity exposure or raising the bar for new purchases, rather than chasing further gains.
None of this requires timing markets perfectly. It requires treating ERP as a standing input in an asset allocation review, checked periodically alongside valuation multiples and macro conditions, rather than a static assumption set once and never revisited.
Should You Adjust ERP for Inflation?
Real terms matter more than most ERP discussions acknowledge, particularly when comparing estimates across different inflation regimes or different countries.
The simplest adjustment strips the risk-free rate and expected stock returns down to real (inflation-adjusted) figures before subtracting one from the other. Since the equity risk premium is a spread between two returns, inflation technically cancels out in principle, both the stock return and the bond return embed the same inflation expectation. In practice, though, nominal and real ERP estimates can diverge because equities and bonds don’t reprice inflation shocks at the same speed. Bonds react almost mechanically to inflation surprises through yield changes, while equity earnings and multiples can take longer to reflect the same shift.
A more careful approach uses real risk-free rates, drawn from inflation-protected government securities, as the baseline, then compares that to a real equity return estimate built from earnings growth net of expected inflation. This method is especially useful when comparing ERP estimates across countries with meaningfully different inflation environments, since a nominal comparison alone can make a high-inflation country’s ERP look artificially elevated or depressed depending on which direction rates are moving. For most individual investor use cases, working in nominal terms consistently, and just being aware of which inflation regime the historical sample reflects, is enough to avoid the biggest distortions.
What Option-Implied ERP Research Tells Investors
Recent Bank of England research uses option prices to back out a forward-looking ERP, capturing what derivatives markets are pricing in right now rather than a historical average or a survey guess. That makes it unusually responsive to shifting sentiment over short horizons.
The tradeoff is that option-implied estimates can diverge meaningfully from CAPE-based or historical measures, and they depend heavily on derivative market liquidity and model assumptions. Treat option-implied ERP as a useful cross-check against your primary estimate, not a replacement for the historical, survey, or implied dividend-based methods covered earlier.
Why Most Valuation Disagreements Are Really ERP Disagreements
Two analysts can look at identical cash flow forecasts for the same company and land on wildly different fair value estimates, not because they disagree about the business, but because they’ve quietly plugged in different equity risk premiums. That’s the part conventional valuation training underplays. The discount rate gets treated as a technical formality, when in practice it’s often the single biggest lever in the entire model.
The uncomfortable truth is that nobody knows the “true” ERP at any given moment. Historical averages describe a past that may not repeat, survey data reflects recency bias more than independent judgment, and implied estimates depend on growth assumptions that are themselves guesses. That doesn’t make the exercise pointless. It means the value of ERP work lies less in landing on a single correct number and more in understanding how much your conclusion depends on the number you chose, and being honest about that fragility rather than hiding it behind false precision.
— Tickerplace
Run Your Own ERP-Based Valuations With Tickerplace
Reading about equity risk premiums is one thing. Plugging real numbers into a real valuation and watching the fair value estimate shift is what actually builds intuition. Some platforms provide individual investors free access to multi-model valuation approaches used by institutional analysts, without needing a Bloomberg terminal or a finance degree to operate them.

Start with the intrinsic value calculator to build a full DCF valuation and test how different ERP and growth assumptions move your fair value estimate. Once you have a number, run it through the stock valuation checker to see how it stacks up against the current market price across thousands of US and ASX-listed companies, updated daily. For investors averaging into a position over time, the stock average price calculator helps track cost basis alongside your valuation work. All three tools are free to use right now at Tickerplace.
Where to Read More on Equity Risk Premium Methodology
For readers who want to go deeper into the source material behind these methods, a handful of resources stand out as the field’s reference points.
- Damodaran’s full ERP paper covers historical, survey, and implied methods in academic depth.
- Damodaran’s country default spread tables provide the standard dataset for country risk premium calculations.
- OpenLearn’s primer on estimating future ERP walks through implied ERP mechanics step by step.
This article is general information, not a substitute for advice from a qualified financial advisor. Consult a qualified financial professional about your own circumstances before acting on anything here.
Sources
- Understanding Equity Risk Premium: Definition and Calculation — Investopedia
- Equity Risk Premiums (ERP): Determinants, Estimation and Implications — Aswath Damodaran
- Country Default Spreads and Risk Premiums — Aswath Damodaran
- How stretched are equity prices? Evidence from option-implied estimates of equity risk premia — Bank of England
FAQ
What Is an Equity Risk Premium?
The equity risk premium is the extra return investors expect from stocks over a risk-free asset like government bonds, and it functions as the (Rm − Rf) term in the CAPM formula used to calculate cost of equity.
What Counts as a Good Equity Risk Premium?
There’s no universal “good” number, but conservative estimates for mature markets like the U.S.
How Is the Equity Risk Premium Calculated?
Analysts use three main methods: historical (subtracting average bond returns from average stock returns over a chosen period), survey (polling investor or analyst expectations), and implied (backing out a required return from current index prices, cash flows, and growth assumptions, then subtracting the risk-free rate).
What Is the Equity Risk Premium for Australian Investors?
Australia is generally treated as a mature market with an ERP in a similar conservative range to the U.S., though the exact figure depends on which method and time period you use; Tickerplace’s intrinsic value calculator lets you test different ERP assumptions directly against ASX-listed valuations.