
WACC Calculation: A Step-by-Step Guide With a Formula
WACC = (E/V × Re) + (D/V × Rd × (1 − T)) — a company’s blended, after-tax cost of raising money from shareholders and lenders combined. Every variable in that equation represents a specific piece of a firm’s capital structure, and getting the wacc calculation right depends entirely on how carefully you source each one.
Here is what each symbol means:
- E — market value of equity (share price times shares outstanding, not book value from the balance sheet)
- D — market value of debt (or net debt, once cash is subtracted)
- V — total capital, or E + D
- Re — cost of equity, the return shareholders require
- Rd — cost of debt, the yield lenders require
- T — the corporate tax rate applied to the tax shield on interest
Platforms like Tickerplace publish daily market capitalization and financial statement data, which matters here because the market value of equity, not the figure sitting on a 10-K, is what belongs in this formula.
Key Takeaways
WACC blends the after-tax cost of debt and the cost of equity, weighted by market value, into a single discount rate for valuing a company’s core operations.
| Point | Details |
|---|---|
| Use the right formula | WACC = (E/V × Re) + (D/V × Rd × (1 − T)), with market values for E and D. |
| Estimate Re with CAPM | Re = Rf + β × (Rm − Rf), matching the risk-free rate’s maturity to your cash flow horizon. |
| Source Rd from real yields | Use yield to maturity on public debt or observed loan rates, then apply the marginal tax rate. |
| Always run a sensitivity table | Report WACC as a range across Rf, ERP, and beta rather than one precise-looking figure. |
| Use Tickerplace for live inputs | Tickerplace supplies daily market caps, financials, and beta data to keep WACC inputs current. |
This article is general information, not a substitute for advice from a qualified financial advisor. Consult a qualified financial professional about your own circumstances before acting on anything here.
Why the WACC Formula Weights by Market Value
The logic behind WACC is simpler than the formula looks. A company raises money from two main sources, equity and debt, and each has a price. Shareholders demand a return for the risk they take (Re), and lenders demand interest for the risk they take (Rd). WACC blends those two costs in proportion to how much of each type of capital the company actually uses.
That’s why the weights (E/V and D/V) use market values instead of book values. Book value reflects what was raised years ago at a historical price. Market value reflects what it would cost the company to raise that same capital today, which is the only number relevant to a forward-looking discount rate. A stock trading at three times book value has a genuinely different equity weight than the balance sheet suggests.
The (1 − T) term exists because interest payments are tax-deductible in most jurisdictions, while dividend payments are not. That deductibility lowers the effective cost of debt, so the formula multiplies Rd by (1 − T) to capture the government’s implicit subsidy on borrowing, often called the tax shield.
Three things to keep in mind as you extend the basic formula:
- Preferred stock gets its own term. If a company has preferred shares outstanding, add a third weighted component, P/V × Rp, where Rp is the preferred dividend yield. Preferred stock gets no tax shield because those payments aren’t tax-deductible.
- Multiple debt tranches need a blended rate. If a firm carries bonds, term loans, and a revolver, weight each tranche’s yield by its share of total debt before plugging a single Rd into the formula.
- Off-balance-sheet debt still counts. Capitalized leases and similar obligations belong in D even when they’re footnoted rather than listed as a line item.
Pro Tip: When a company has more than one type of debt, build a mini weighted-average calculation for Rd alone before you plug it into the main WACC formula. Treating a low-coupon bond and a high-rate credit line as equal understates real borrowing cost.
How to Calculate Cost of Equity With CAPM
Cost of equity is the hardest number in the whole calculation because, unlike a bond’s yield, no market quotes it directly. The Capital Asset Pricing Model remains the standard approach: Re = Rf + β × (Rm − Rf).
Rf is the risk-free rate, almost always the yield on a government bond that matches your cash flow horizon. For a ten-year DCF, use the 10-year Treasury yield, not a short-term bill rate. Mixing time horizons here is one of the more common errors analysts make, because a 3-month bill yield understates the true opportunity cost embedded in a long-duration valuation.
Beta (β) measures how much a stock’s returns move relative to the broader market. You have three practical ways to get one:
- Historical regression. Run a stock’s weekly or monthly returns against an index like the S&P 500 over three to five years. This is the textbook method but can be noisy for thinly traded stocks.
- Published beta. Financial data platforms calculate and publish betas directly, which saves the regression work; Tickerplace’s beta guide walks through how these figures get built and where they can mislead you.
- Unlever and re-lever. Pull betas from several comparable firms, strip out each one’s leverage effect to get an unlevered (asset) beta, average those, then re-lever using your target company’s own debt-to-equity ratio. Standard procedures for this approach are well documented and particularly useful for private companies or firms with unstable capital structures.
Statistic Callout: Estimating betas and risk premiums relies on historical data, comparable-firm analysis, or implied methods, and regression-based historical betas remain the standard starting point even when analysts adjust them afterward.
The equity risk premium, Rm − Rf, represents the extra return investors expect for holding stocks over risk-free bonds. There’s no single correct number here. Long-run historical averages, forward-looking implied premiums, and survey-based estimates all diverge somewhat, so document which source you used and why. Consistency across a model matters more than chasing the “perfect” premium.
CAPM isn’t the only route to cost of equity. The dividend discount model (Re = D1/P0 + g) works reasonably well for mature, dividend-paying companies with stable payout growth, but it breaks down fast for growth stocks or companies that don’t pay dividends at all. An implied cost of equity, backed out from a stock’s current price and analyst growth forecasts, can serve as a useful cross-check against a CAPM estimate, especially when beta feels unreliable.
Whichever method you choose, write down your risk-free rate source, your beta source and lookback period, and your equity risk premium assumption. A WACC number without documented inputs is not reproducible, and a reproducible calculation is the entire point of doing this carefully.
How Do You Estimate the Cost of Debt?
Cost of debt is the more forgiving half of the WACC calculation. Unlike equity, debt has an observable price, which is exactly why cost of debt is usually easier to pin down than cost of equity.
For a public company with traded bonds, the cleanest source is yield to maturity on outstanding issues. That figure reflects what the market currently demands to lend to this specific company, at this specific point in time, given its current credit profile. For a private company or one without public bonds, look at the average interest rate on existing loans, or estimate a credit spread over the risk-free rate based on the firm’s credit rating and compare it to similarly rated public issuers.
A few practical rules for handling messier debt situations:
- Use observed yields whenever they exist. They’re a real market price, not an estimate, and they update automatically as credit conditions shift.
- Fall back to implied credit spreads for unrated or private debt. Match the company’s leverage and coverage ratios to a rating category, then apply that category’s typical spread over the risk-free rate.
- Blend multiple tranches by their share of total debt. A firm with a low-coupon legacy bond and a newer, higher-rate term loan should weight each by outstanding balance, not average the coupons naively.
- Exclude preferred stock from the tax-adjusted debt calculation entirely. Preferred dividends receive no tax deduction, so preferred stock needs its own weighted term with no (1 − T) adjustment, as covered above.
- Watch for off-balance-sheet obligations. Capitalized lease commitments and unfunded pension liabilities function economically like debt and should be added to D even though they rarely sit inside a clean “total debt” line.
Once you have Rd, the tax adjustment is where most of the remaining judgment calls live. The formula calls for Rd × (1 − T), but which T? The marginal tax rate, the statutory rate that applies to the next dollar of taxable income, is the theoretically correct choice for a forward-looking discount rate, because the tax shield’s value depends on the rate that will apply to future interest deductions. The effective tax rate, calculated from a company’s actual tax expense divided by pre-tax income, reflects past credits, deductions, and one-time items that may not repeat.
Pro Tip: Use the statutory marginal rate for the jurisdiction where the debt was issued, not a blended effective rate pulled from a recent income statement. A company that paid an unusually low effective rate last year due to a one-time credit will otherwise inflate its estimated tax shield and understate its true cost of capital.
A Worked WACC Example You Can Build in Excel
Numbers make this concrete faster than another paragraph of theory. Consider a hypothetical mid-cap industrial company with these inputs:
Walking through the logic step by step in Excel:
- Compute E, D, and V first (rows 1 to 3), then derive the weights (rows 4 and 5) so any later change in market cap or debt automatically recalculates the whole sheet.
- Build Re using the CAPM formula in row 9, referencing separate cells for Rf, beta, and ERP so you can swap assumptions without rewriting the formula.
- Apply the tax adjustment to Rd in a standalone cell (row 12), never buried inside the final WACC formula, so the tax shield’s effect stays visible and auditable.
- Multiply each cost by its weight (rows 13 and 14), then sum them for the final figure in row 15.
This structure turns WACC from a one-off number into a live model. Change the beta assumption and every downstream cell, including the final 8.32%, updates instantly, which is exactly what you want when you move into sensitivity testing.
Should You Use Market Values or Book Values?
Use market values for E and D whenever a company is publicly traded, full stop. Market values reflect what it would actually cost to replace that capital today, while book value reflects a historical accounting entry that may be decades stale. A company that issued debt in a low-rate environment years ago will show a deceptively cheap Rd on paper if you rely on the coupon rate instead of current yield to maturity.
For private companies, market value of equity doesn’t exist, so the standard workaround is comparable company multiples. Apply a peer group’s EV/EBITDA or price-to-book multiple to the private firm’s own financials to approximate what its equity would trade for if it were listed.
Net debt, meaning total debt minus cash and cash equivalents, is the more defensible weighting choice for most firms. Subtracting liquid cash from gross debt reflects the reality that a large cash balance could repay debt tomorrow if the company chose to. For a firm sitting on a large cash hoard relative to its debt load, using gross debt instead of net debt can meaningfully overstate leverage and distort the resulting WACC. This guide to reviewing capital structure walks through how investors should think about leverage ratios more broadly.
A few more adjustments worth making before you finalize weights:
- Capitalize operating leases and add them to debt if the company’s disclosures separate them out, since they function as fixed financing obligations.
- Treat minority interests as a separate claim on enterprise value rather than folding them into either equity or debt.
- Use the marginal tax rate consistently across the whole model, not a blended rate that changes depending on which section of the valuation you’re building.
- Recheck weights whenever a company issues new equity, retires debt, or buys back shares, since capital structure is not static.
How Sensitive Is WACC to Its Assumptions?
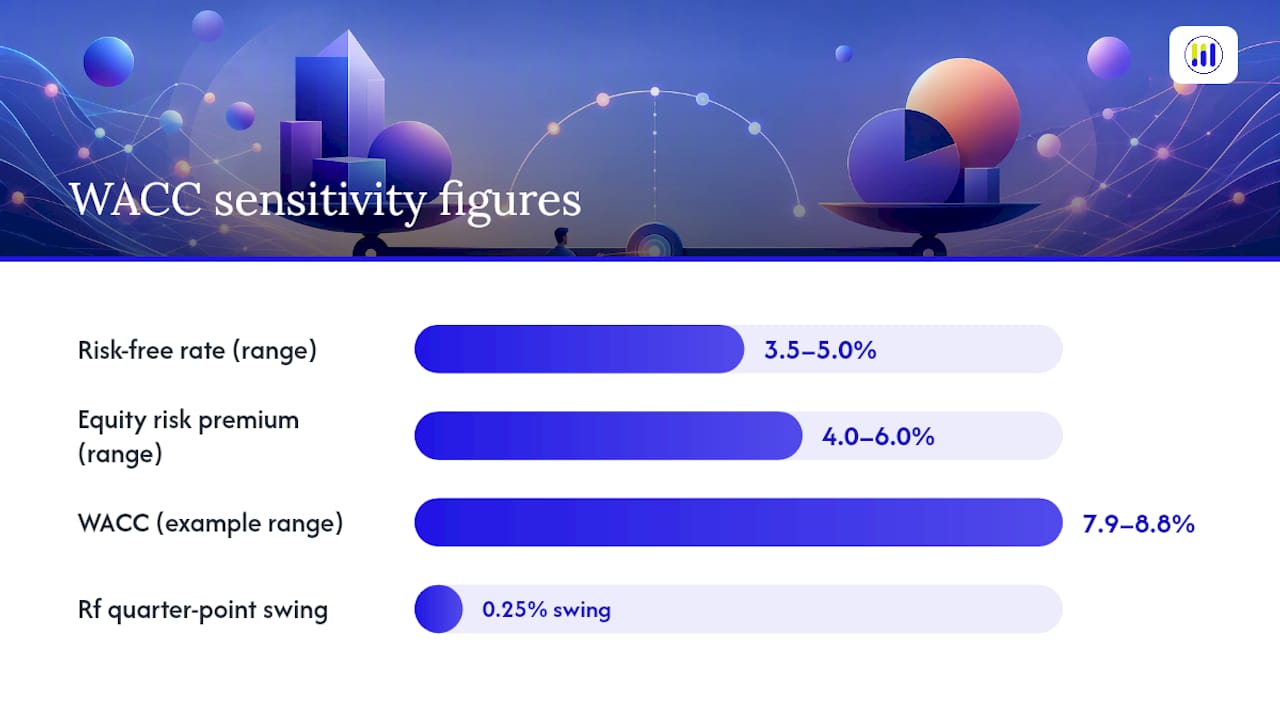
WACC is only as reliable as its shakiest input, and that input sensitivity is well documented rather than a minor footnote. A quarter-point swing in the risk-free rate or a half-point swing in beta can move a company’s discount rate enough to change a DCF’s conclusion from undervalued to overvalued.
Build a sensitivity table before you trust a single WACC figure:
- Set up a two-variable data table in Excel with risk-free rate on one axis and equity risk premium on the other, then let the sheet recalculate Re and WACC across a grid, say Rf from 3.5% to 5.0% and ERP from 4.0% to 6.0%.
- Run a second table pairing beta against pre-tax cost of debt, since these two inputs tend to move independently and both affect the final number directly.
- Report the resulting WACC as a range, such as “7.9% to 8.8%,” rather than a single misleadingly precise figure like 8.32%.
Statistic Callout: WACC’s sensitivity to input choice is significant enough that analysts are generally advised to run a sensitivity table rather than lean on one point estimate, since small shifts in the risk-free rate or beta can swing a valuation’s conclusion.
The most common mistakes stack on top of each other in practice: mixing book value debt with market value equity in the same weighting calculation, using a beta that’s five years stale for a company that has since changed its business mix, ignoring a recent debt issuance or buyback that shifted the capital structure, and applying the tax shield to preferred dividends by mistake. Any one of these quietly corrupts the entire model.
When Should You Use WACC as a Discount Rate?
WACC is the correct discount rate specifically for unlevered free cash flow, meaning cash flow available to all capital providers before interest payments. Discounting those cash flows at WACC and summing them gives you enterprise value, the value of the whole business independent of how it’s financed.
That distinction matters because using WACC on the wrong cash flow stream produces a wrong answer. A few situations where a different rate applies:
- Valuing equity cash flows directly (dividends, or free cash flow to equity after interest and debt repayment) calls for the cost of equity alone, not WACC, since those cash flows already belong only to shareholders.
- Comparing project returns against a hurdle rate typically starts with WACC as the baseline, adjusted upward for projects riskier than the company’s average business.
- M&A and acquisition modeling often uses the target’s own WACC, or a blended rate reflecting the acquirer’s post-deal capital structure, rather than the acquirer’s existing WACC unchanged.
Investors running their own DCF models on a stock can plug a calculated WACC directly into an enterprise value estimate to check whether a company’s current market price implies a discount rate the market is comfortable with.
How Tickerplace Supports WACC-Based Analysis
Building an accurate WACC by hand means pulling market capitalization, debt balances, and financial statements from several different places and hoping none of them are stale. Tickerplace consolidates that groundwork into one platform.
- Daily-updated market capitalization and share price data supply the market value of equity, the E in the formula, without needing a separate quote lookup.
- Company financial statements provide debt balances, interest expense, and cash positions needed to calculate net debt and estimate Rd.
- The beta guide and published beta figures give a starting point for CAPM without running your own regression.
- The debt-to-equity calculator helps confirm the D/E ratio behind your weighting before it feeds into a DCF.
Pro Tip: Cross-check any beta or market cap figure against two dates a few weeks apart. A stock that just had an earnings surprise or a large buyback announcement can show a temporarily skewed beta or share count that throws off an otherwise careful calculation.
Where Standard WACC Advice Falls Short
Most guides treat WACC as a formula to memorize rather than a set of judgment calls to defend. The math is genuinely the easy part; multiplying weights by costs takes thirty seconds once you have clean inputs. The real skill is knowing which risk-free rate to pull, whether a beta is stale, and whether book value debt is quietly distorting your weights.
The biggest gap between textbook treatment and practice is precision theater. A single-point WACC like “8.32%” looks authoritative but hides enormous input uncertainty, particularly around beta and the equity risk premium. Presenting a range and a sensitivity table isn’t a hedge. It’s the more honest and, frankly, more professional output.
If you take one thing from this guide, prioritize market-value weights and documented assumptions over chasing a “more sophisticated” cost of equity model. A simple CAPM estimate built on current market data beats an elaborate model built on stale or unsourced inputs every time. Sequence matters here: fix your data sources first, then worry about model sophistication.
— Tickerplace
Put Your WACC to Work With Tickerplace’s Valuation Tools
Calculating WACC by hand across spreadsheets, bond yield pages, and financial statements works, but it’s slow, and every stale data point quietly corrupts the final number. Tickerplace pulls daily market capitalization, debt figures, and financial statements for thousands of US and ASX-listed companies into one place, so the E, D, and V inputs behind your WACC stay current without a separate research detour.

Once you have a WACC figure, Tickerplace’s stock valuation calculator lets you apply it directly as a discount rate across DCF, P/E, and P/S models to see whether a stock’s current price makes sense. If you want to stress-test a discount rate against a specific company’s intrinsic value, the intrinsic value calculator runs that scenario in seconds rather than requiring a rebuilt spreadsheet each time. Both tools are free to use, and pulling up a ticker to test your own WACC assumptions against Tickerplace’s published fair value estimate is the fastest way to see whether your inputs hold up.
Sources
- Weighted average cost of capital (WACC) definition | Investopedia
- WACC Formula, Definition and Uses - Corporate Finance Institute
- Calculating the Weighted Average Cost of Capital | OpenStax
- Standard Procedures for Estimating CAPM Parameters, Betas and Alphas (Damodaran/Stern materials)
FAQ
What Is the Formula for Calculating WACC?
WACC equals (E/V × Re) + (D/V × Rd × (1 − T)), where E and D are the market values of equity and debt, V is their sum, Re and Rd are the costs of equity and debt, and T is the tax rate applied to the debt tax shield.
What Does a WACC of 12% Mean?
A 12% WACC means the company must generate at least a 12% return on its invested capital just to cover what it pays its shareholders and lenders combined, making any project or investment returning less than that value destructive rather than value creating.
How Do I Calculate WACC in Excel?
Set up separate cells for market cap, debt, risk-free rate, beta, equity risk premium, pre-tax cost of debt, and tax rate, then build formulas that derive weights, calculate Re through CAPM, apply the tax adjustment to Rd, and sum the two weighted components, exactly as shown in the worked example above.
What Does WACC Really Tell You?
WACC tells you the minimum return a company’s investments need to clear to justify how that capital was raised, and it serves as the standard discount rate for valuing unlevered free cash flow in a DCF model.
Should I Use Book Value or Market Value for WACC Weights?
Market value should be the default for public companies, since it reflects the current cost of raising that same capital today, while book value only works as a fallback for private firms without traded equity.