
Stock Risk Assessment: A Practical Guide for Investors
Risk assessment in stocks is the systematic process of identifying the ways an investment can lose money, estimating the likelihood and size of those losses, then deciding whether the expected return justifies taking those risks. Investopedia defines it as evaluating the likelihood and potential severity of loss using both quantitative and qualitative inputs. For individual investors, that translates to three immediate actions:
- Identify the specific risks attached to a stock: business model fragility, sector concentration, leverage, regulatory exposure.
- Quantify the biggest measurable risks: calculate or look up the stock’s standard deviation, maximum drawdown, and beta relative to the S&P 500.
- Decide on position size or avoidance based on whether the expected return compensates for those measured risks.
Tools like Tickerplace can support all three steps by generating daily intrinsic value estimates and margin-of-safety calculations across 10,000+ U.S. and ASX-listed equities.
Key Takeaways
Effective stock risk assessment combines quantitative metrics with qualitative scenario analysis, documented assumptions, and a scheduled review cadence tied to material events.
| Point | Details |
|---|---|
| Define risk before sizing | Identify specific hazards and estimate likelihood before calculating position size. |
| Use multiple metrics | Pair standard deviation, beta, drawdown, and VaR; no single number captures full risk. |
| Document and date assumptions | Record growth rate, discount rate, and macro assumptions with a firm reassessment date. |
| Set trigger-based reviews | Reassess immediately after earnings surprises, debt changes, or management departures. |
| Tickerplace for valuation risk | Use the intrinsic value calculator and valuation watchlist to quantify and monitor valuation-driven risk. |
What does a stock risk assessment actually cover?
A thorough stock risk evaluation draws on two distinct categories of inputs, and ignoring either one leaves your analysis incomplete.
Quantitative inputs give you measurable, historically grounded signals:
- Standard deviation: measures how widely a stock’s returns scatter around its average; higher values indicate greater price variability.
- Beta: compares a stock’s price movements to a benchmark like the S&P 500; a beta above 1.0 signals amplified market sensitivity.
- Maximum drawdown: the largest peak-to-trough decline over a period; often a better predictor of investor behavior than standard deviation alone.
- Value at Risk (VaR): estimates the maximum expected loss over a set period at a given confidence level (e.g., 95%).
- Liquidity measures: bid-ask spread and average daily volume, particularly relevant for small-cap holdings.
Qualitative inputs capture risks that no spreadsheet fully prices in:
- Business model resilience under competitive or technological disruption
- Management track record and capital allocation history
- Regulatory, legal, or geopolitical exposure
- Competitive moat strength and customer concentration
The critical limitation: past volatility does not reliably predict future outcomes and can badly underestimate tail risk during market dislocations. Small-cap stocks compound this problem because historical data is thinner and liquidity can evaporate quickly. Pairing quantitative metrics with qualitative scenario analysis is not optional; it is the foundation of sound stock investment risk assessment.
According to Investing, a complete assessment also distinguishes between market risk, credit risk, and liquidity risk, and separates an investor’s risk tolerance (psychological comfort with loss) from their risk capacity (financial ability to absorb it).
How to run a step-by-step stock risk assessment
Risk assessment works best as a proactive process: identify hazards before they become problems, because crisis management costs far more than prevention. The following workflow gives you a reproducible, dated process for each stock you evaluate.
- Identify hazards. List every material way the stock can lose value: earnings miss, sector rotation, leverage spike, regulatory action, key-person departure.
- Set assumptions and date them. Record your current macro assumptions (interest rate path, sector growth rate) and the date you made them. Undated assumptions cannot be reviewed meaningfully.
- Select metrics. Choose the quantitative measures appropriate to the stock’s size and data availability: standard deviation and beta for large caps; drawdown and liquidity measures for small caps.
- Run calculations. Compute or source each metric. Compare against a relevant benchmark and against the stock’s own historical range.
- Decide on position size. Map the risk level to your tolerance and capacity. A stock with high drawdown risk warrants a smaller position; one with low beta and strong qualitative scores can carry more weight.
- Document the assessment. Record assumptions, metrics, mitigation actions, and a firm reassessment date.
Decision checklist: Go (full target weight) / Reduce (half weight, set stop) / Avoid (risk exceeds return at any reasonable position size).
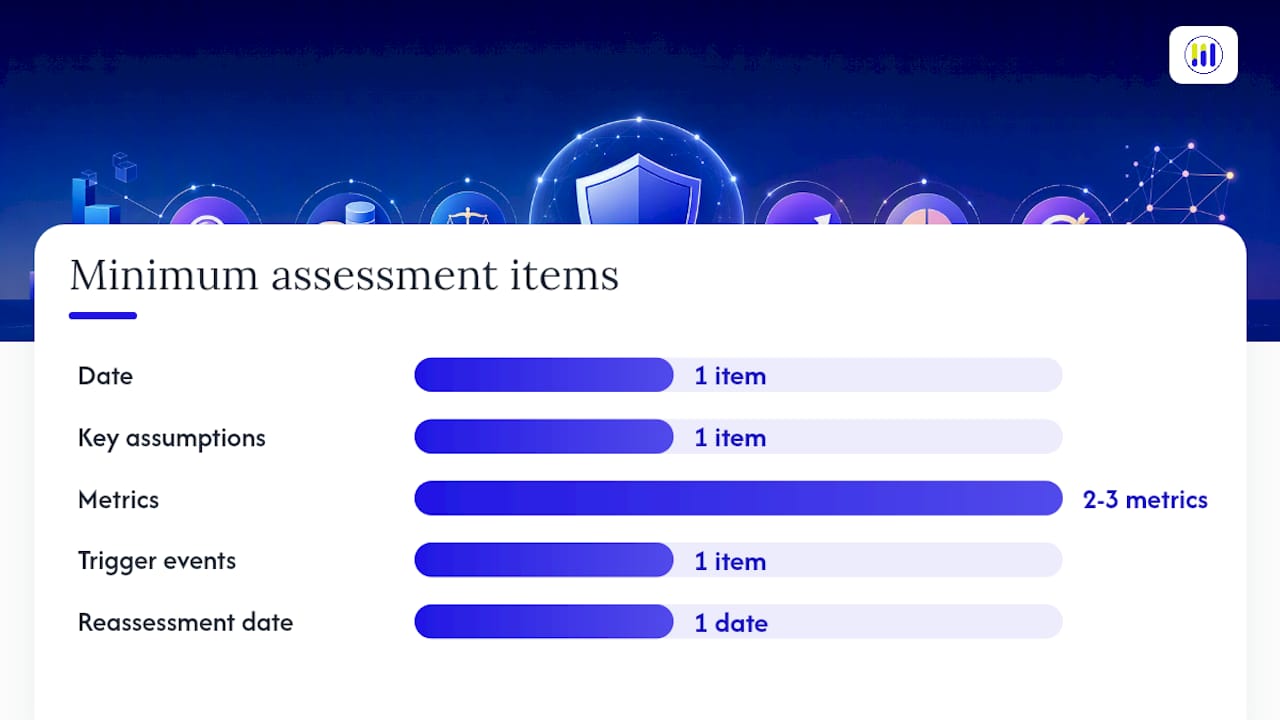
Pro Tip: Every assessment document should contain at minimum: the date, the key assumptions driving your thesis, the two or three metrics you relied on, the trigger events that would force an immediate reassessment (e.g., debt-to-equity ratio crossing a threshold), and the scheduled review date.
Key quantitative metrics: how to compute and interpret them
Practical portfolio risk analysis runs on three levels: individual asset behavior, correlations among assets, and whole-portfolio metrics. No single number tells the full story.
| Metric | What it measures | Sample value | Key limitation |
|---|---|---|---|
| Standard deviation (annual) | Return variability | A representative value indicating typical stock volatility | Treats upside and downside volatility equally |
| Beta | Sensitivity to benchmark | A typical stock beta indicates sensitivity to market movements | Assumes a linear, stable relationship to the index |
| Maximum drawdown | Worst peak-to-trough loss | A significant historical loss value illustrating downside risk | Historical; future drawdowns can exceed it |
| Value at Risk (95%, 1-month) | Probable maximum loss | An estimated maximum probable loss over a month at standard confidence | Underestimates tail events by design |
| Sharpe ratio | Return per unit of total risk | A sample Sharpe ratio demonstrating risk-adjusted returns | Penalizes upside volatility the same as downside |
| Sortino ratio | Return per unit of downside risk | A representative Sortino ratio illustrating downside risk adjustment | Requires sufficient negative-return observations |
Over 36 monthly observations, the regression-derived beta smooths out noise.
Pro Tip: *Maximum drawdown is the metric most correlated with investors abandoning their plan at the worst moment.
For a deeper look at how beta works in practice, the Tickerplace guide to beta in stocks walks through benchmark selection and common misinterpretations.
How to reduce and manage stock risk in your portfolio
Mitigation does not mean eliminating risk; it means calibrating it. Analyzing company financials, market conditions, and diversification are the three practical pillars individual investors rely on most.
Core mitigation strategies:
- Diversification: spreading capital across sectors, geographies, and asset classes reduces concentration risk without necessarily reducing expected return.
- Position sizing: limiting any single stock to a defined percentage of the portfolio caps the damage from a single adverse event.
- Stop-loss rules: predetermined exit prices remove emotion from drawdown decisions; most effective when set at technically meaningful levels, not arbitrary percentages.
- Hedging: using inverse ETFs, put options, or precious metals as portfolio ballast can offset equity drawdowns during market stress.
- Rebalancing: periodic rebalancing forces you to trim positions that have grown beyond their target weight, systematically reducing concentration.
- Cash reserves: maintaining a cash buffer preserves optionality and prevents forced selling during drawdowns.
Pro Tip: Match mitigation to your investment horizon. Stop-losses suit short-to-medium-term positions but can trigger unnecessary exits in long-term holdings during temporary volatility. For long-horizon investors, position sizing and rebalancing typically deliver better risk-adjusted outcomes than stop-loss rules, with lower transaction costs and fewer taxable events.
For a structured look at risk management principles and tools, Tickerplace’s dedicated guide covers rebalancing mechanics and position-sizing frameworks in detail.
When and how to review your risk assessments
Risk assessment is an objective, living process: assumptions must be made explicit, findings documented, and assessments periodically reviewed. A one-time evaluation is not an assessment; it is a guess with a timestamp.

Recommended cadence by investor time horizon:
| Investor horizon | Routine review | Event-triggered review |
|---|---|---|
| Short-term (under 1 year) | Monthly | After any earnings release or guidance change |
| Medium-term (1–5 years) | Quarterly | After major macro shifts, litigation, or rating changes |
| Long-term (5+ years) | Semi-annually | After business-model disruption or management change |
Documentation template fields:
- Date of assessment
- Stock ticker and position size at assessment date
- Key assumptions (growth rate, discount rate, macro environment)
- Metrics recorded (SD, beta, drawdown, VaR, Sharpe)
- Identified risks and their estimated likelihood/impact
- Mitigation actions taken
- Trigger events that would force early reassessment
- Scheduled next review date
How Tickerplace helps you operationalize risk assessment
Translating the workflow above into actual numbers requires calculators and data. Tickerplace provides the tools to run valuation-driven risk checks without institutional-grade subscription costs.
Relevant Tickerplace features for risk assessment:
- Intrinsic value calculator supporting DCF, P/E, and P/S models
- Stock valuation checker for quick over/undervaluation signals by ticker
- Margin-of-safety inputs that translate valuation gaps into position-size guidance
- Side-by-side stock comparison for relative risk profiling
- Valuation watchlist to track fair value changes and flag reassessment triggers
Mini example workflow:
- Run the intrinsic value calculator on a stock you are considering.
- Note the gap between current price and intrinsic value estimate; a stock trading 30% above intrinsic value carries meaningful valuation risk regardless of its beta.
- Set your margin of safety threshold (e.g., only buy at 20% below intrinsic value).
- Use that threshold to determine maximum position size: the wider the valuation gap above your entry, the smaller the initial position.
- Add the stock to your valuation watchlist so price-to-value changes trigger a reassessment automatically.
Pro Tip: *Tools automate the calculations, but they cannot replace scenario-based qualitative judgment.
The metric investors fixate on is usually the wrong one
Most individual investors anchor on volatility, specifically standard deviation, because it is the number most platforms display first. For a long-term investor, they are not.
Maximum drawdown and recovery time are the metrics that actually predict whether you will stay invested through a difficult period. The second stock will test your conviction in ways the volatility number never warned you about.
The deeper issue is that good risk assessment separates measurable historical risks from hypothetical ones: volatility and drawdown come from the past; valuation resets and business-model disruptions are forward-looking scenarios that require qualitative reasoning. Investors who treat the historical metrics as a complete picture tend to be surprised by exactly the risks that were never in the data.
Tickerplace puts institutional-grade risk tools in your hands
Individual investors now have access to the same valuation framework that institutional analysts use, without the cost. Tickerplace’s free platform delivers daily intrinsic value estimates across 10,000+ U.S. and ASX-listed stocks, margin-of-safety calculators, and a valuation watchlist that flags when a stock’s fair value changes materially.

For the risk assessment workflow in this guide, the stock valuation calculator and intrinsic value checker give you the quantitative foundation; the watchlist handles ongoing monitoring. Investors who want deeper scenario analysis and full DCF breakdowns can upgrade to Tickerplace Pro for access to historical financials and advanced screeners. Start with the free tools, run your first valuation-driven risk check today at Tickerplace, and treat the result as one input in a broader assessment, not a buy or sell recommendation.
Sources
- Risk Assessment: Definition, Techniques, and Analysis Types Explained
- Risk assessment
- PMC article on risk assessment (HSE framing)
- Investing
This article is general information, not a substitute for advice from a qualified financial advisor. Consult a qualified financial professional about your own circumstances before acting on anything here.
FAQ
What is risk assessment in stocks?
Risk assessment in stocks is the process of identifying how an investment can lose value, estimating the likelihood and severity of those losses, and deciding whether the expected return justifies the risk. It uses both quantitative metrics (beta, drawdown, VaR) and qualitative inputs (business model, management quality).
What is the difference between risk tolerance and risk capacity?
Risk tolerance is your psychological comfort with potential losses; risk capacity is your financial ability to absorb them without disrupting your goals. A sound assessment accounts for both, since high tolerance with low capacity leads to positions you cannot afford to hold through a drawdown.
How often should you review a stock risk assessment?
Long-term investors should review assessments at least semi-annually, with immediate reassessment triggered by earnings surprises, debt covenant changes, management departures, or major macroeconomic shifts.
Why is maximum drawdown more useful than standard deviation alone?
Standard deviation treats upside and downside variability equally, while maximum drawdown measures the actual worst-case loss an investor would have experienced. Drawdown is more directly tied to the behavioral risk of abandoning a position at the worst possible time.
How does Tickerplace support stock risk assessment?
Tickerplace provides an intrinsic value calculator, a stock valuation checker, margin-of-safety inputs, and a valuation watchlist that together let individual investors quantify valuation risk and monitor fair value changes across 10,000+ equities, free of charge.