
What Is Risk Assessment for Stock Investors?
TL;DR:
- Risk assessment involves systematically identifying and evaluating threats to an investment before committing capital. It helps determine if the embedded risk justifies the expected return by quantifying hazards and prioritizing mitigation efforts. Using multiple valuation models and regular updates, investors can make informed decisions to maintain an adequate margin of safety.
Risk assessment is the systematic process of identifying, analyzing, and evaluating potential threats to a stock or portfolio before capital is committed. For investors, it answers a specific question: is the risk embedded in this position proportionate to the return you expect? The immediate action after reading this guide is straightforward — run an intrinsic value check using a DCF or P/E screen, compare the result to the current market price, and flag any gap larger than your margin-of-safety threshold. That single step converts abstract risk awareness into a concrete, repeatable decision.
Table of Contents
- What risk assessment means for stock investors
- Which quantitative metrics help you measure stock risk
- A practical 6-step workflow for assessing a single stock
- How to read assessment outputs and convert them into decisions
- Common mistakes and red flags to watch for
- Practical tools and data sources for running assessments
- Key Takeaways
- Risk assessment is more useful than most investors realize
- Tickerplace makes the risk assessment workflow faster
- Useful sources
- FAQ
What risk assessment means for stock investors
Risk assessment gathers objective facts about what risks exist and how large they are; risk management then decides what to do about them. For investors, the distinction matters because it keeps the analytical phase free of bias. You collect evidence first, then decide.
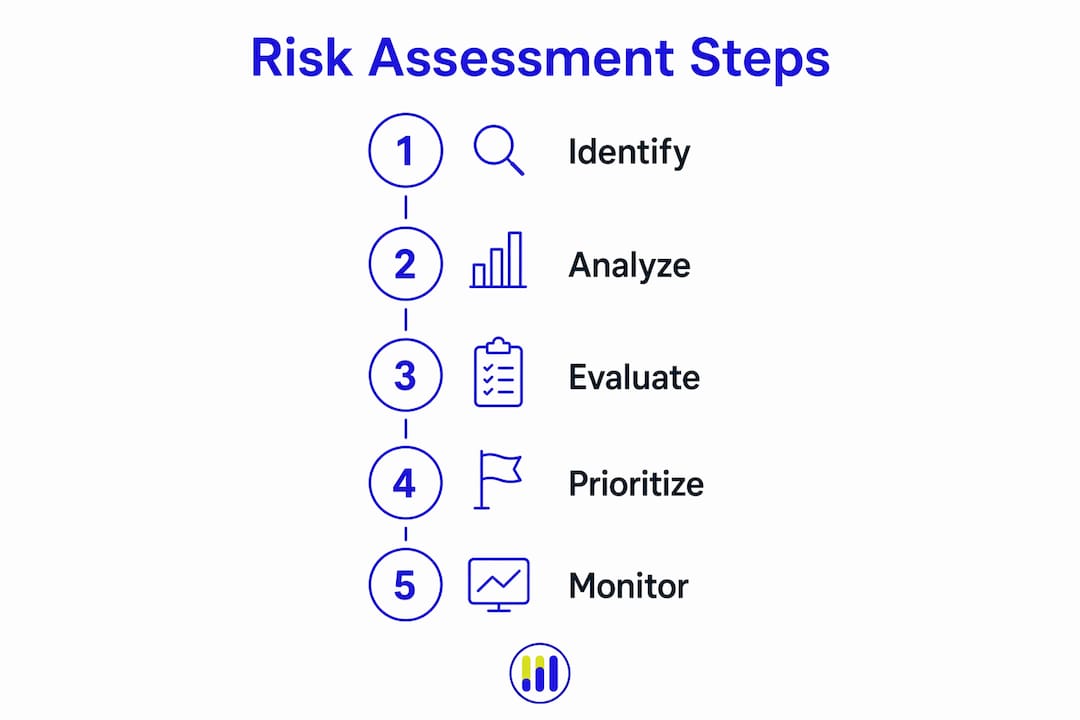
The structure follows three phases adapted from the NIST framework:
- Identify hazards — economic cycles, interest rate shifts, management missteps, regulatory change, product obsolescence, leverage, liquidity constraints, and business model disruption.
- Analyze likelihood and impact — quantify how probable each hazard is and how severely it could affect earnings, cash flow, or valuation multiples.
- Evaluate and prioritize — rank risks by combined severity, then decide which ones require mitigation, monitoring, or acceptance.
Probability estimates are inherently uncertain. Use ranges and sensitivity testing rather than single-point forecasts; a model that outputs one number creates false precision. The assessment provides the factual foundation; your risk appetite determines how you respond.
Pro Tip: Document every assumption with a date stamp when you complete an assessment. When new information arrives, you can compare the updated inputs against the originals and see exactly what changed, rather than rebuilding from scratch.

Which quantitative metrics help you measure stock risk
Multi-model valuation using DCF, P/E, and P/S ratios is the standard approach for triangulating intrinsic value and testing whether the market price leaves an adequate margin of safety. No single metric tells the full story.
| Metric | What it measures | Practical use |
|---|---|---|
| DCF (Discounted Cash Flow) | Intrinsic value based on projected free cash flows | Compare to market price; a large gap signals material over/undervaluation |
| P/E Ratio | Price relative to earnings | Screen for relative over/undervaluation vs. sector peers |
| P/S Ratio | Price relative to revenue | Useful for pre-profit or low-margin companies where earnings are volatile |
| Beta | Sensitivity to broad market moves | A beta above 1.0 amplifies market swings in both directions |
| Standard Deviation / ATR | Historical price volatility | Quantifies how widely returns have dispersed around the mean |
| Value at Risk (VaR) | Maximum expected loss at a confidence level over a time horizon | Useful for position-level loss budgeting |
| Downside Deviation | Volatility of negative returns only | More relevant than standard deviation for loss-averse investors |
| Drawdown | Peak-to-trough price decline | Historical drawdowns inform stop-loss policy and position sizing |
Beta deserves a closer look. A stock with a beta above 1.0 amplifies market swings in both directions; a beta below 1.0 dampens them. Neither is inherently good or bad — it depends on your portfolio’s existing exposure and your investment horizon.
Qualitative factors sit alongside these numbers. Risk management in finance requires both qualitative checks — management quality, governance, competitive moat — and quantitative models. A company with strong financials but a board under investigation carries risk that no ratio captures on its own.
A practical 6-step workflow for assessing a single stock
A full assessment of one stock typically takes several hours using public filings and a valuation calculator. Subscription data platforms reduce that time considerably for analysts running multiple names. Follow this stock price assessment sequence:
- Set context and objectives. Define your investment horizon (short-term trade vs. multi-year hold) and your risk appetite. Knowing how much loss you can tolerate is necessary before deciding which risks require mitigation.
- Identify material hazards. Review the 10-K/10-Q risk factors section, recent earnings calls, and industry news. List every material threat: macro, sector, and company-specific.
- Build quantitative inputs. Calculate or source DCF intrinsic value, P/E and P/S multiples, beta, trailing volatility, and debt-to-equity ratio. Tickerplace provides daily intrinsic value estimates across 10,000+ equities, which shortens this step significantly.
- Run sensitivity and scenario analysis. Vary your key DCF assumptions — revenue growth rate and discount rate — to see how intrinsic value responds. The table below illustrates a simple sensitivity grid.
- Evaluate and prioritize risks. Rank identified hazards by probability × impact. Compute your margin of safety: intrinsic value minus market price, expressed as a percentage.
- Decide position sizing and set monitoring triggers. Link position size to assessed downside risk. Define the events that would prompt a reassessment (earnings miss, management change, macro shift).
Sensitivity example — intrinsic value at varying growth and discount rate assumptions:
A spread this wide across plausible assumptions is itself a risk signal. When the range is narrow, confidence in the central estimate is higher.
Risk registers and periodic reassessments are standard practice in established frameworks. Build a simple one-page log for each stock: hazard, severity score, mitigation, and review date.
How to read assessment outputs and convert them into decisions
The goal of risk assessment in investing is to align risk with expected return, not to eliminate uncertainty. Once you have an intrinsic value estimate and a prioritized risk list, apply these decision rules:
- Intrinsic value exceeds market price by 20% or more: the position offers a meaningful margin of safety; consider initiating or adding.
- Gap is within 10% in either direction: the stock is fairly priced; monitor for a better entry or exit point.
- Market price exceeds intrinsic value by more than 20%: the margin of safety is negative; avoid or reduce the position.
Position sizing should reflect assessed downside risk directly. A stock with high beta, elevated leverage, and a narrow margin of safety warrants a smaller allocation than a low-beta name trading at a significant discount to intrinsic value. Many investors cap any single position at a small percentage of portfolio value when uncertainty is high, scaling up only as confidence in the assessment improves.
Inherent risk (before any mitigation) and residual risk (after diversification, stop-losses, or hedges) are distinct. Mitigation reduces exposure but never eliminates it. Systemic events — a broad market correction, a credit crisis — affect even well-hedged portfolios.
Common mistakes and red flags to watch for
Skipping formal risk assessment effectively leaves long-term outcomes to chance, because cascading impacts between risks and strategic goals go undetected. The most frequent errors:
- Overreliance on a single metric. A low P/E ratio does not make a stock safe if leverage is extreme or cash flow is negative.
- Confusing volatility with risk. A volatile stock is not automatically risky if it trades well below intrinsic value; a stable stock can be deeply risky if it is severely overvalued.
- Ignoring liquidity. Thinly traded small-caps carry execution risk that standard models do not capture.
- Treating point estimates as facts. A single DCF output is a scenario, not a prediction.
- Failing to update. An assessment completed six months ago may be materially stale after an earnings restatement or a rate cycle shift.
Company-level red flags to check before completing any assessment:
- Recurring negative free cash flow with no credible path to profitability
- Debt-to-equity ratio rising faster than revenue
- Sudden or unexplained management turnover
- Opaque or frequently restated accounting
- Revenue concentration in one customer or geography at a high level
When you spot multiple red flags simultaneously, widen your sensitivity ranges, reduce position size, and seek independent data sources before committing capital.
Practical tools and data sources for running assessments
“Effective risk assessment enables calculating a margin of safety — the difference between intrinsic value and market price — to protect against unforeseen market volatility. A multi-model approach using DCF, P/E, and P/S ratios helps investors triangulate intrinsic value and understand model sensitivity.” — IBM, What is risk management?
Free and low-cost sources:
- SEC EDGAR (10-K, 10-Q filings) for primary financial data
- Tickerplace for daily intrinsic value estimates, multi-model valuation (DCF, P/E, P/S), margin-of-safety calculator, and a stock valuation checker
- FRED (Federal Reserve Economic Data) for macro inputs
- Public company investor relations pages for earnings transcripts
Paid / institutional sources:
- Bloomberg Terminal or Refinitiv Eikon for granular scenario work, options-implied volatility, and real-time data
- FactSet for consensus estimates and historical financials
For most individual investors, SEC filings combined with Tickerplace’s valuation calculators cover the full workflow at no cost. Paid terminals add value primarily when you need options-implied volatility, real-time data, or high-confidence position sizing on larger trades. Simulation-based scenario analysis techniques can further stress-test assumptions beyond standard sensitivity grids.
Key Takeaways
Risk assessment is a structured, three-step process (identify → analyze → evaluate/prioritize) that gives investors objective facts about stock-level threats before any capital decision is made.
| Point | Details |
|---|---|
| Three-step structure | Identify hazards, analyze likelihood and impact, then prioritize by severity before acting. |
| Multi-model valuation | Use DCF, P/E, and P/S together to triangulate intrinsic value; no single metric is sufficient. |
| Margin of safety | A gap of 20% or more between intrinsic value and market price signals a meaningful buffer against downside. |
| Document and update | Date-stamp every assumption and reassess after material events — risk is dynamic, not static. |
| Tickerplace | Provides daily intrinsic value estimates, multi-model valuation, and margin-of-safety calculators for 10,000+ equities at no cost. |
Risk assessment is more useful than most investors realize
The conventional wisdom treats risk assessment as a compliance exercise — something institutions do before regulators ask. For individual investors, that framing misses the point entirely. The real value is not the risk register or the sensitivity table; it is the discipline of separating what you know from what you are assuming.
Most investing mistakes trace back to a single failure: treating an assumption as a fact. A DCF model that uses an 8% growth rate for the next decade is not a forecast — it is a hypothesis. Running the same model at 4% and 12% tells you how sensitive your conviction is to that hypothesis. That range is more informative than the central estimate.
Tickerplace is built around this principle. Transparent, multi-model fair-value estimates make the assumptions visible, not hidden inside a black box. When you can see that a stock looks undervalued on a P/E basis but overvalued on a DCF basis, you have a genuine analytical question to resolve — not a false sense of certainty. Treat every assessment as a living document, revisit it after earnings releases or macro shifts, and let the updated data challenge your original thesis rather than confirm it.
Tickerplace makes the risk assessment workflow faster
Individual investors running the six-step workflow above spend most of their time on data collection and valuation modeling. Tickerplace eliminates that bottleneck. The platform delivers daily intrinsic value estimates for 10,000+ US and ASX-listed equities, covering DCF, P/E, and P/S models simultaneously, so you arrive at the sensitivity and prioritization steps with the quantitative inputs already built.

Key features that support the workflow directly:
- Intrinsic value calculator — run a DCF-based intrinsic value estimate with your own inputs or use Tickerplace’s pre-populated figures
- Stock valuation calculator — cross-check P/E and intrinsic value models side by side for a complete picture
- Margin-of-safety calculator — quantify the gap between fair value and market price in seconds
Tickerplace is free to use for core valuation tools, with a Pro upgrade available for full DCF breakdowns, scenario analysis, and advanced screeners. Start with the stock valuation checker to get an immediate overvalued/undervalued signal on any stock you are researching.
Useful sources
- NIST Computer Security Resource Center — Risk Assessment: authoritative definition of the three-phase structure; use when documenting your assessment methodology.
- CISA — Risk Management: government-level framing of risk identification, analysis, and mitigation; useful for understanding how frameworks translate to practice.
- Wikipedia — Risk Assessment: broad overview of hazard identification, likelihood analysis, and consequence evaluation across disciplines.
- Wikipedia — Risk Management: covers qualitative and quantitative approaches, including the inherent vs. residual risk distinction.
- TechTarget — What Is Risk Assessment?: clear explanation of how assessment differs from analysis and management; good reference for framing assumptions.
- IBM — What Is Risk Management?: covers multi-model valuation and margin-of-safety concepts in a business and finance context.
FAQ
What is risk assessment in simple terms?
Risk assessment is the process of identifying potential threats to an investment, estimating how likely and severe each one is, and ranking them so you can act on the most material risks first.
How does risk assessment differ from risk management?
Risk assessment gathers objective facts about what risks exist and how large they are; risk management decides how to respond — through mitigation, diversification, acceptance, or avoidance.
What is a margin of safety in stock risk assessment?
The margin of safety is the percentage difference between a stock’s intrinsic value and its current market price. A gap of 20% or more in favor of intrinsic value signals a meaningful buffer against downside.
How often should you update a stock risk assessment?
Reassess after any material event — an earnings release, a management change, a significant macro shift, or a move in the stock price that closes or widens the margin of safety. Static assessments become misleading quickly.
Can Tickerplace help with stock risk assessment?
Yes. Tickerplace provides daily intrinsic value estimates using DCF, P/E, and P/S models for 10,000+ equities, along with a margin-of-safety calculator and a stock valuation checker — covering the core quantitative steps of the workflow at no cost.