
Historical Financial Data: Sources, Workflows and Analysis Ready Tools
Start with public regulators and exchanges for standardized, free access: the Reserve Bank of Australia for macro and market series, the SEC’s Financial Statement Data Sets for standardized company filings, and FRED for index-level history. When you need deeper vintage coverage or point-in-time snapshots, commercial vendors like S&P Compustat and EODData fill the gaps. Analysts use this historical financial data for three things: ratio analysis, backtesting, and valuation modeling.
TL;DR:
- Public sources like the Reserve Bank of Australia, SEC, and FRED provide free macro, company, and index data, but often lack depth or vintage coverage needed for detailed analysis.
- Fundamental data includes detailed financial statements and ratios, with formats varying widely, requiring careful documentation to ensure comparable analysis.
- Cleaning data involves standardizing definitions, handling missing values consistently, and correctly adjusting for corporate actions like splits and dividends to avoid skewed results.
- Always verify licensing and attribution requirements, especially when combining public and commercial datasets, to avoid legal and compliance issues.
- Tickerplace offers ready-to-use historical financials with ratios and valuation tools for US and ASX companies, streamlining the process for investors and analysts.
What Historical Financial Data Actually Includes
The phrase “historical financial data” covers more ground than most new investors expect. Before you commit to a dataset, know exactly which fields it carries and in what file shape, because a source that’s rich in price history might be thin on fundamentals, and vice versa.
Market-level data typically includes:
- Open, high, low, close (OHLC), plus adjusted close and trading volume.
- Intraday bars, offered by some commercial vendors but rarely by free public sources.
- Dividend history, split history, and delisting or corporate-action timelines.
Fundamental data goes deeper into the financial statements themselves: income statement lines, balance sheet items, cash flow entries, and often precomputed ratios like return on equity or debt to equity. Formats vary just as widely. You’ll encounter plain CSV exports, JSON or CSV responses from APIs, XBRL tagged filings, and full SQL or data warehouse exports for larger research projects. Always check the accompanying documentation before you build anything on top of a new feed. Field definitions are not universal. “Revenue” in one dataset might exclude items that another includes, and that mismatch quietly wrecks comparisons.
How to Download and Access Historical Data (Step by Step)
Getting from “I found a source” to “I have usable data on my machine” involves a few repeatable steps, whether you’re pulling macro series or company financials.
- Start at the source portal. Central bank and exchange websites let you export standard time series directly. Check the available date range and default file format before downloading anything.
- Pull standardized company financials. For fundamentals, download the SEC’s XBRL or FSDS files directly, or use an API that already standardizes line items. Confirm whether you’re getting “as filed” figures or a standardized restatement.
- Register for commercial API keys. Vendors like Compustat and EODData require account setup, and most enforce rate limits and licensing terms. Test on a small date range before running a bulk pull that could burn through your quota.
- Log your provenance. Note the source, pull date, and version for every file you save. You’ll thank yourself later when a number looks off and you need to trace it back.
Watch for a handful of recurring gotchas: timezone and market-close conventions differ by exchange, adjusted versus unadjusted pricing changes every return calculation downstream, and missing corporate-action records silently distort long-run price series.
Pro Tip: Keep a simple provenance log, source name, pull date, file version, next to every dataset you save. When a number looks wrong six months later, that log is the fastest way to find out whether the data changed or your logic did.
Turning Historical Data Into Analysis: Workflows That Work
Raw numbers don’t tell you much on their own. Ratio analysis is what turns historical financial data into something comparable across companies of different sizes, and it remains central to fundamental analysis for exactly that reason. A $2 billion company and a $200 million company can’t be compared on raw net income, but their profit margins, return on equity, and leverage ratios sit on the same scale.
Two techniques extend that logic across time:
- Horizontal analysis tracks a single line item, like revenue or operating margin, across several years to spot structural shifts.
- Vertical (common-size) analysis expresses every line as a percentage of a base figure, usually revenue, making it easier to catch margin compression that a raw dollar comparison would miss.
Backtesting introduces its own hazards. Lookahead bias creeps in when a model unintentionally uses information that wasn’t actually available at the time being tested. Survivorship bias skews results when a dataset only includes companies that still exist today, quietly deleting every bankruptcy and delisting from the sample. And incorrect corporate-action handling, a missed split or an unadjusted dividend, can flip a backtest’s conclusion entirely. Point-in-time datasets that preserve pre-restatement values, the kind Compustat offers, exist specifically to guard against these distortions in serious backtest work.
A Checklist for Choosing the Right Dataset
Before you commit budget or engineering time to a data source, run through this sequence.
- Define your time depth, frequency, and universe. Do you need 10 years of daily prices for 500 ASX tickers, or 50 years of annual data for a handful of blue chips?
- Confirm the fields you actually need are present. Adjusted price, full dividend history, and complete financial statement line items aren’t guaranteed just because a source looks comprehensive.
- Check refresh cadence and restatement policy. A dataset that overwrites prior-period figures without preserving the original filing can quietly corrupt a backtest.
- Weigh cost against integration effort. A free source that needs heavy cleaning might cost more in analyst hours than a modest commercial subscription.
How Tickerplace Supports Historical-Data Workflows
Tickerplace builds its multi-model valuation tools directly on top of daily-updated financials for more than 10,000 US and ASX-listed equities, combining DCF, P/E, and P/S approaches into a single intrinsic value estimate. That matters for this article’s core problem: most investors don’t want a raw data dump, they want numbers already organized for analysis.
- Historical financial statements arrive pre-organized with ratios already computed, cutting out a step most analysts otherwise handle in a spreadsheet.
- Ticker-level pages, like the ones covering ASX-listed companies, pair historical pricing with valuation context in one view.
- Sample financials pages, such as APA’s statement history, show the depth of line-item detail available for a single company.
- Daily updates mean the fair value targets you’re working from reflect the latest filings, not a stale quarterly snapshot.
Cleaning and Preparing Historical Financial Data for Analysis
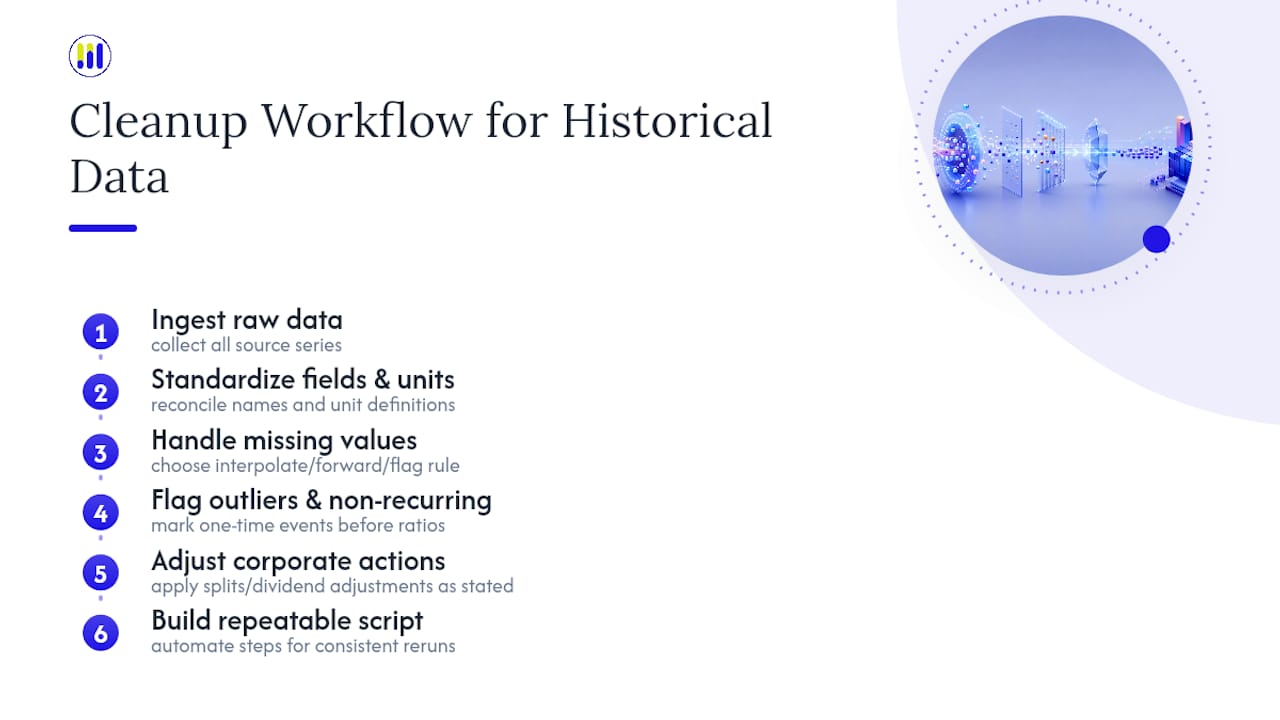
Raw historical data almost never arrives analysis-ready, and skipping the cleanup step is how quiet errors end up in a valuation model. Start by standardizing field names and units across every source you combine. One vendor’s “total revenue” might exclude other operating income that a second vendor folds in, and merging them without reconciling definitions produces numbers that look precise but mean different things.
Missing values need a documented rule, not a silent fill. Decide up front whether a gap gets interpolated, carried forward from the last known value, or left blank with a flag, and apply that rule consistently across the entire series. Outliers deserve the same discipline: a one-time asset sale that spikes net income for a single quarter will distort a trailing average unless you flag it as non-recurring before running ratio calculations.
Corporate actions are the most common source of silent data corruption. A stock split that isn’t reflected in historical prices makes a company look like it crashed 50% overnight when nothing actually happened to its value. Dividend reinvestment assumptions change total return calculations meaningfully over long horizons, so confirm whether a price series is adjusted for dividends, splits, both, or neither before you trust a single return figure. Building a repeatable cleaning script, even a simple one, pays for itself the first time you rerun an analysis on updated data.
Legal and Compliance Considerations for Using Historical Financial Data
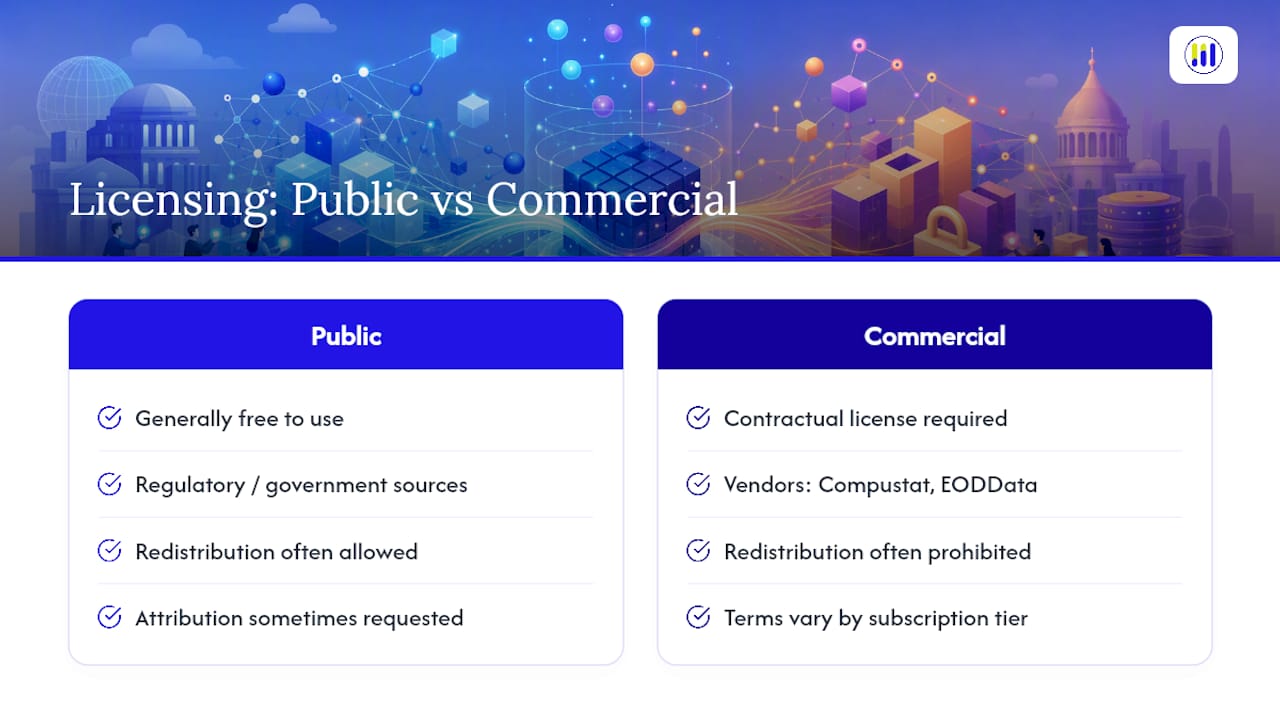
Licensing terms differ sharply between public and commercial sources, and conflating them is a common, avoidable mistake. Data published by the SEC and the Reserve Bank of Australia is generally free to use because it originates from public regulatory and government functions. Commercial datasets from vendors like Compustat and EODData come with contractual licensing terms that govern redistribution, and those terms vary by subscription tier.
Redistribution is where most compliance problems start. A license that permits internal analysis often prohibits republishing the raw dataset, or even derived figures, in a commercial product without a separate agreement. Before you build a public-facing tool, article, or product on licensed data, read the redistribution clause specifically, not just the general usage terms.
Attribution requirements also vary. Some sources ask for a citation whenever their data appears in published work; others require nothing at all for research use but restrict commercial use entirely. When in doubt on a specific licensing question, the safest move is checking directly with the data provider rather than assuming a public source’s terms extend to a commercial one, or that a commercial vendor’s terms match what you saw on a free portal.
What Long-Term Investors Should Prioritize
Standardized statements make cross-company comparison possible, but analysts should keep as-filed records on hand for narrative context restatements can hide. Before backtesting anything, confirm how a dataset handles point-in-time data. No single source fits every project; pairing public series with a targeted commercial feed is usually the pragmatic answer.
— Tickerplace
Get Started With Tickerplace’s Historical Data Tools
Once you know which sources hold the historical financial data you need, the next question is what to do with it, and that’s where most free portals leave you on your own. Tickerplace closes that gap: valuation-ready historical financials, downloadable statement history for ASX and US tickers, and built-in calculators that turn raw numbers into intrinsic value estimates without a spreadsheet rebuild.

Core features are free to use. Pull up a ticker, review its historical financials, and run the stock valuation calculator against your own assumptions, or try the intrinsic value calculator to see how a company’s fair value estimate holds up against its current price. For readers pairing historical datasets with live trade analysis, tools like real-time trade analysis platforms can round out a broader research stack. Start with a ticker you already track and see how the numbers line up.
This article is general information, not a substitute for advice from a qualified financial advisor. Consult a qualified financial professional about your own circumstances before acting on anything here.
Sources
Every serious analyst builds a mental map of where financial records history actually lives, and it usually splits into three tiers: public institutions, academic archives, and commercial vendors. Each tier trades off cost against depth, and knowing which one to reach for first saves hours of chasing the wrong file.
Public institutions are the natural starting point for macro and market-level series. The Reserve Bank of Australia publishes extended time series on exchange rates and financial aggregates, and it costs nothing to download. On the corporate side, the SEC’s Financial Statement Data Sets deliver numeric filing data in flattened and XBRL formats, refreshed quarterly and stretching back several years.
Academic centers fill a different niche. Yale’s Historical Financial Research Data archive, for instance, holds long-run price, dividend, and capitalization series built for research rather than trading.
Commercial vendors earn their subscription fees through vintage and standardization:
- Financial Statement Data Sets | SEC
- Historical data | Reserve Bank of Australia
- S&P 500 (SP500) | FRED | St. Louis Fed
FAQ
Where Can I Get Historical Options Data for Free?
Free options data is limited compared to equity price history, but exchange websites and some brokerage platforms publish historical options chains at no cost, though depth and history length vary considerably by provider.
How Can I Get Historical Stock Data for Free?
Public sources like FRED offer free index-level series, and platforms like Tickerplace provide daily-updated historical financials and pricing for thousands of US and ASX-listed equities at no cost.
What Is an Example of Historical Data?
A daily closing price series for a stock over the past ten years, paired with its dividend and split history, is a straightforward example of historical financial data used in ratio analysis and backtesting.
What Is the Best Website to Find Financial Data?
There’s no single best source for every use case: the SEC’s Financial Statement Data Sets suit standardized company filings, while Tickerplace combines historical financials with valuation tools for investors who want ratios and fair value estimates without building models from scratch.