
Finance Teams: 2–3 Revenue Forecasting Methods to Backtest
The most dependable approach for most finance teams is a hybrid forecast that blends a time-series baseline, near-term pipeline weighting, and driver-based adjustments by segment. No single model earns full trust on its own. Triangulating two or three approaches costs more in data discipline and governance, but the payoff is a forecast leadership can actually defend in a board meeting.
TL;DR:
- Hybrid forecasting that combines time-series, pipeline weighting, and driver adjustments offers the most defendable revenue projections, especially for board presentations.
- Quantitative methods like exponential smoothing, regression, and Monte Carlo require specific data inputs and should be backtested with MAPE under 10% for reliable use.
- Qualitative inputs become critical when data is thin, markets are disrupted, or new products lack historical patterns, and should be documented thoroughly.
- A hybrid model should be built and maintained through recurring, disciplined processes that include baseline establishment, scenario analysis, and regular validation against actuals.
- External valuation tools can serve as sanity checks to compare growth assumptions against market pricing, helping to avoid inflated forecasts.
What Are the Core Revenue Forecasting Methods?
Revenue forecasting methods split into two families: quantitative techniques that run on historical numbers, and qualitative techniques that capture judgment the numbers can’t see. Most finance teams that report accurate numbers use both, not one or the other.
The quantitative side includes:
- Straight-line (run-rate) forecasting: extends a fixed growth rate forward. Best for stable, mature businesses with low volatility.
- Moving average: smooths recent periods to reduce noise. Best for businesses with mild seasonality and frequent short-term reporting needs.
- Exponential smoothing / FORECAST.ETS: weights recent data more heavily and models seasonal cycles automatically. Best for retailers, subscription businesses, and anyone with a repeating seasonal pattern.
- Regression (simple and multiple): ties revenue to one or more drivers, like ad spend, headcount, or website traffic. Best for businesses with clear causal drivers and at least a few years of clean data.
- Monte Carlo simulation: runs thousands of randomized scenarios to produce a probability distribution instead of one number. Best for high-uncertainty environments like new product launches or volatile markets.
Qualitative methods matter most when historical data is thin, a market is new, or a disruption has broken the pattern the numbers used to follow:
- Delphi method: structured, anonymous rounds of expert input converging on a consensus estimate.
- Expert opinion: informed judgment from sales leaders, category managers, or industry veterans.
- Market research: customer surveys, win/loss interviews, and competitive intelligence that inform assumptions baked into the quantitative model.
A useful shortcut for choosing: startups without revenue history lean qualitative and top-down; subscription businesses lean cohort-based and exponential smoothing; enterprise sales organizations lean pipeline-weighted; retail leans on ETS for seasonality. Salesforce’s breakdown of five quantitative and three qualitative methods is a solid starting checklist if you’re building a model from scratch.
How Do Quantitative Revenue Forecasting Techniques Work?
Each quantitative method answers a different question about your data, and picking the wrong one for your situation is the single most common forecasting mistake finance teams make.
-
Straight-line forecasting assumes revenue grows at the same rate every period. The formula is simple: multiply last period’s revenue by (1 + growth rate). It works when growth is genuinely linear, but it ignores seasonality entirely and will mislead you the moment your business has a slow quarter baked into its normal rhythm.
-
Moving average takes the average of the last several periods to project the next one. A three-month moving average, for instance, averages the last three months of actuals. A weighted moving average assigns more importance to recent months. Both smooth out noise, but they lag behind sudden shifts, so they’re weak at catching inflection points like a new product launch or a lost major customer.
-
Exponential smoothing and FORECAST.ETS solve the lag problem by weighting recent observations more heavily and, in ETS’s case, explicitly modeling seasonal cycles. This is the Excel function analysts reach for when a business has a repeating seasonal pattern, like a retailer with a predictable holiday spike. The Corporate Finance Institute recommends FORECAST.ETS specifically for businesses with consistent historical seasonality, since it adjusts the trend line automatically rather than requiring a manual seasonal index.
-
Regression analysis ties revenue to one or more independent variables. Simple regression uses one driver (say, marketing spend); multiple regression uses several (spend, headcount, pricing changes). The output is a formula: revenue = intercept + (coefficient × driver value). The catch is driver selection. Include a variable that’s correlated but not causal, and the model will look statistically clean while producing forecasts that fall apart the moment the correlation breaks down. Multiple regression also demands more historical data points than most early-stage companies have.
-
Monte Carlo simulation takes your key assumptions (growth rate, churn, close rate, deal size) and runs each through a probability distribution rather than a single point estimate. The output isn’t one number. It’s a range, often expressed as “70% probability of landing between EX and BY.” This matters most when you’re forecasting into genuine uncertainty, like a new market entry where three or four variables could each swing independently.
Pro Tip: Run every quantitative method through a backtest before trusting it. Take a period you already know the actual result for, feed the model only the data available up to that point, and compare its forecast to what actually happened.
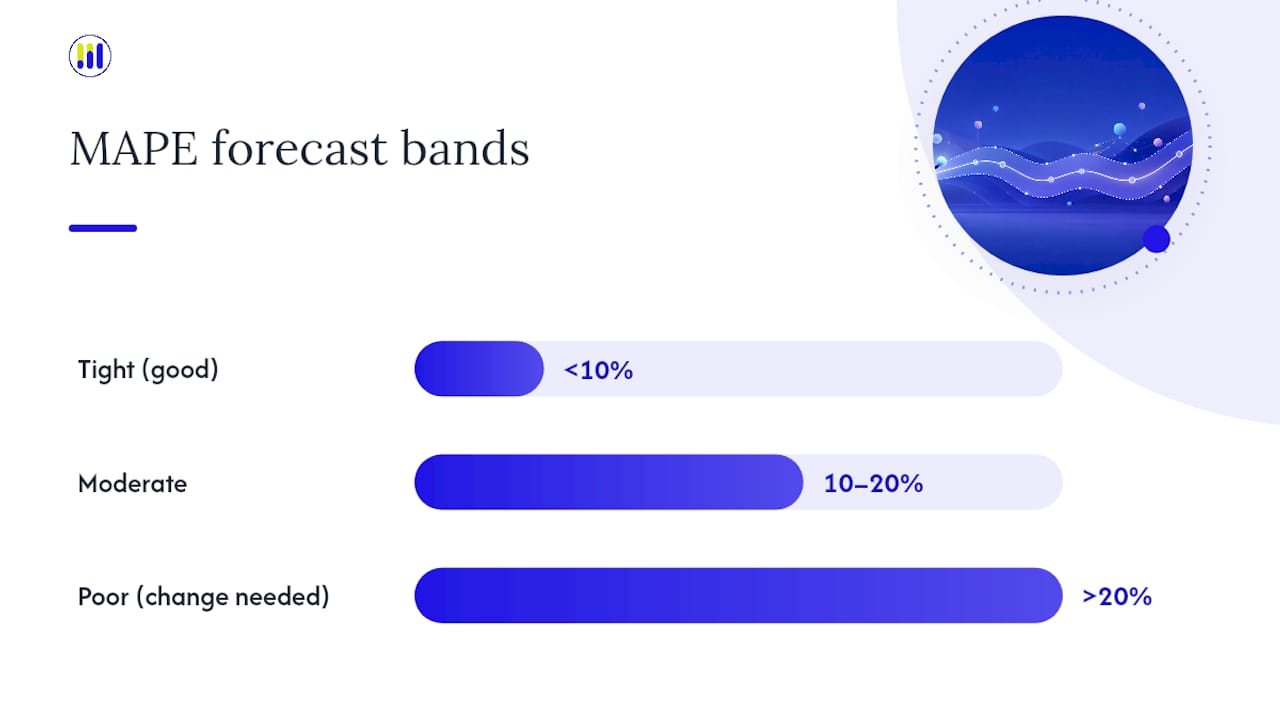
The metric that matters here is MAPE (Mean Absolute Percentage Error), which tells you, on average, how far off your forecast was as a percentage of actual revenue. A model with a MAPE under 10% for a quarterly forecast is generally considered tight; anything above 20% signals you need a different method or better inputs, not just a tweak to the existing formula. CFI’s guidance on forecasting techniques treats backtesting and confidence intervals as a non-negotiable step before any quantitative model goes into a budget cycle, not an optional polish at the end.
When Should You Use Qualitative Forecasting Methods?
Qualitative methods earn their place when the numbers alone can’t tell the whole story, which happens more often than most finance teams admit. A new product line has no historical pattern to extrapolate. A market disruption, the kind seen during COVID-19, breaks the seasonal curve your ETS model was trained on. In both cases, structured judgment fills the gap the data leaves open.
- Delphi method: assemble five to eight subject-matter experts, sales leaders, and category specialists. Circulate an anonymous first-round estimate, share the aggregated range back to the group without names attached, and run a second round. Anonymity matters because it strips out the tendency for junior voices to simply defer to whoever is most senior in the room.
- Expert opinion: faster but less rigorous than Delphi. Best used for quick sanity checks on a quantitative output, not as the primary method for a number that will anchor the annual budget.
- Market research: customer surveys, win/loss interviews, and pricing sensitivity studies convert into assumptions, like expected close rate or average deal size, that then feed directly into the quantitative model rather than replacing it.
Document every qualitative input the same way you’d document a data source: who provided it, what assumption it changed, and how much weight it carried in the blended forecast. A forecast that mixes a regression output with “the sales VP thinks Q3 will be strong” needs a clear record of how much that opinion moved the final number, or the whole exercise becomes impossible to audit next quarter. Harvard Business School Online’s overview of forecasting methods makes the same point: qualitative and quantitative methods work best combined, not chosen as alternatives to each other.
Which Forecasting Framework Fits Your Business Model?
The method you pick (regression, ETS, Monte Carlo) answers “how do I calculate this.” The framework answers a different question: “what am I actually building the calculation on top of.” Most finance teams default to one framework without realizing there are several, each suited to a different business model.
- Bottom-up: builds revenue from the smallest unit up, rep by rep, product by product, or customer segment by segment, then sums to a total. It’s granular and defensible, but slow to build and easy to double-count if two segments overlap.
- Top-down: starts from a market-level or company-level number (total addressable market, last year’s total revenue) and works down. Faster to produce, useful as a sanity check, but weaker on the specifics a CFO will get grilled on.
- Pipeline-weighted: multiplies each open deal’s value by its stage’s historical close rate, then sums across the pipeline. This is where most B2B sales forecasts live, and it’s also where most forecasts quietly fail, because teams use CRM default probabilities instead of their own calculated close rates. Practitioner guidance on B2B revenue forecasting recommends calculating actual stage-by-stage close rates from at least four quarters of closed deals, a recommendation echoed by Bentleys’ guidance for Australian companies on building realistic stage probabilities.
- Run-rate and MRR: annualizes a recent period (multiply monthly recurring revenue by 12) to project forward. Simple and fast, but it assumes no churn, no expansion, and no seasonality, which makes it a rough floor estimate rather than a real forecast for most subscription businesses.
- Cohort or segment-based: tracks revenue by the month or quarter a customer joined, following each cohort’s retention and expansion curve separately. This is the gold standard for subscription businesses because it exposes churn and expansion trends that a blended MRR number hides completely.
The strongest forecasts don’t pick one framework. They run two or three in parallel and report a floor, likely, and ceiling range rather than a single point number. When the bottom-up capacity check and the pipeline-weighted number disagree by more than a small margin, that gap is itself useful information, not noise to average away. It usually means either the pipeline is inflated or the capacity assumptions are stale.
How Do You Choose the Right Forecasting Method?
Four questions narrow the decision fast: how far out are you forecasting, what’s your revenue model, how many deals or transactions feed the number, and how clean is your underlying data.
Time horizon splits the decision immediately. Short-term predictions (next 30 to 90 days) favor pipeline-weighted and moving-average methods, since near-term visibility from an active sales pipeline beats a long-range trend line. Long-term revenue forecasting (annual budgets, multi-year plans) favors regression, cohort builds, and scenario-based Monte Carlo work, where you’re modeling structural drivers rather than reading the current pipeline.
Before building anything, confirm you actually have the inputs the method requires:
- At least four quarters of revenue history, ideally eight or more for anything seasonal
- CRM stage-by-stage history, not just current pipeline snapshot
- Average deal size and sales cycle length by segment
- Churn and expansion rates if any part of revenue is recurring
- A record of pricing changes, since a regression model blind to a mid-year price increase will misattribute the resulting revenue jump to the wrong driver
| Method | Data needed | Implementation effort | Best time horizon |
|---|---|---|---|
| Straight-line / run-rate | 1 to 2 periods | Low, hours | Short-term, stable business |
| Moving average | 3 periods | Low, hours | Short-term |
| Exponential smoothing / ETS | 12+ periods with seasonality | Medium, a day | Short to medium-term |
| Regression | 2+ years, clean driver data | Medium to high, days | Medium to long-term |
| Monte Carlo | Distributions for each key driver | High, a week or more | Long-term, high uncertainty |
| Pipeline-weighted | 4+ quarters of CRM stage data | Medium, ongoing upkeep | Short-term |
| Cohort/segment-based | Cohort-level retention data | High, ongoing | Medium to long-term |
For a small finance team with limited bandwidth, the minimum viable forecast is a moving average or ETS baseline layered with a pipeline-weighted near-term adjustment. That combination alone catches most of the accuracy gain a full hybrid model would deliver, at a fraction of the setup time.
How Do You Build a Hybrid Forecasting Program?
Building a hybrid forecast isn’t a one-time modeling exercise. It’s a recurring process with clear ownership and a validation rhythm, and skipping the governance step is why so many otherwise well-built models drift out of accuracy within two quarters.
- Set the baseline. Run a time-series method (moving average or ETS) against historical revenue to establish what the business would do with no intervention.
- Layer the pipeline. Add pipeline-weighted revenue using historical, not CRM-default, close rates by stage.
- Apply driver and segment adjustments. Adjust for known factors the baseline can’t see: a new hire ramping, a price change, a lost enterprise account.
- Build the scenario range. Produce a base case, a downside case, and an upside case, each with its assumptions written down explicitly rather than implied.
- Reconcile and report. Where the models disagree by more than a small margin, investigate before reporting a blended number.
Run this as a rolling forecast, updated monthly or at minimum quarterly, rather than a static annual budget revisited once a year. Trigger an off-cycle reforecast whenever a single deal shifts a quarter’s number by more than a defined threshold, or whenever a macro event (a rate change, a supply disruption, a COVID-style shock) invalidates the historical pattern your baseline was trained on.
Validate on a fixed rhythm using MAPE against actuals each period, and treat two consecutive misses above your threshold as a signal to revisit inputs, not just tighten the model. The most common fixes are the same ones every time: recalculate CRM close rates using real historical data instead of defaults, purge pipeline entries with stale or unrealistic close dates, and run a bottom-up capacity check to catch pipeline inflation before it reaches the board deck. CFA Institute’s guidance on company analysis and forecasting treats scenario reconciliation as a core analyst discipline, not an optional add-on.
One governance point gets skipped too often: keep the steering forecast (the number finance uses to plan cash and headcount) separate from the incentive forecast (the number sales is compensated against). Blending the two creates pressure to inflate the pipeline number, which corrupts the very data your close rates depend on.
Where Do Valuation Tools Fit Into Revenue Forecasting?
A pro forma revenue build is only as credible as the growth and margin assumptions behind it, and that’s precisely where a top-down sanity check earns its keep. Before locking in a multi-year growth driver, it helps to see what the market has actually priced in for comparable companies. Tools like a CAGR calculator turn historical growth into a defensible compound rate you can compare against your own model’s assumption, rather than pulling a growth number out of thin air.
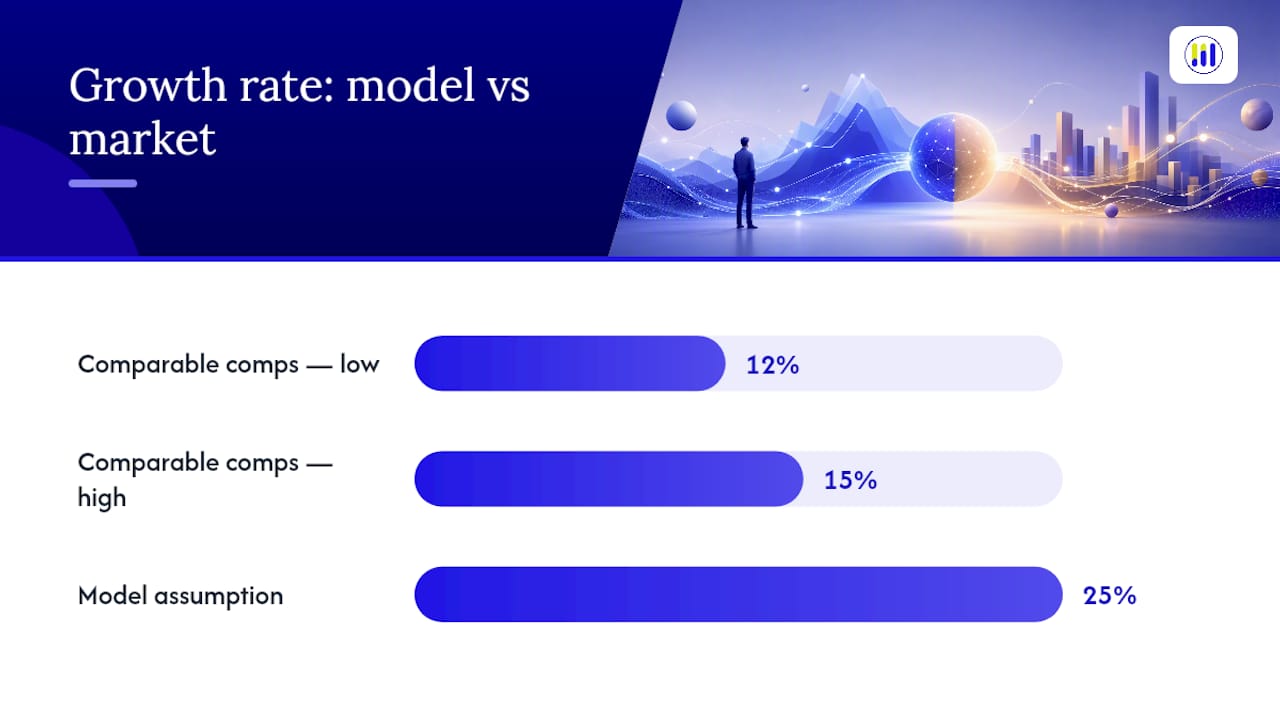
A calculator hub covers intrinsic value, margin, and return-based tools across a wide range of US and ASX-listed companies, updated daily, which makes it useful for pulling a quick outside-in growth or margin benchmark. If your bottom-up build assumes 25% annual growth but comparable public companies in your category are valued on 12% to 15%, that gap is worth investigating before the number goes into a budget. It doesn’t replace your driver-based model, but it does catch an assumption that’s badly out of step with what similar businesses actually deliver.
The Case for Discipline Over Precision
The biggest misconception in revenue forecasting isn’t about which formula to use. It’s the belief that a more sophisticated model produces a more accurate number. In practice, a simple moving average with disciplined, honest CRM inputs will consistently outperform a complex regression model built on inflated pipeline data. Triangulation works not because it’s mathematically superior, but because it forces you to notice when two independent views of the same business disagree.
Make the check a monthly habit: run your top-down and bottom-up numbers side by side, and treat any gap over 10% as a question, not an average to smooth over. Write down every assumption behind every scenario. A forecast nobody can trace back to its inputs isn’t a forecast. It’s a guess with a spreadsheet attached.
— Tickerplace
Use Tickerplace Calculators as a Forecasting Sanity Check
Beyond the driver-based models finance teams build internally, there’s a faster way to bound a top-down scenario before the full forecast is done: pull outside-in benchmarks from a platform built for exactly that. A platform gives individual investors and analysts free access to institutional-grade valuation data, DCF, P/E, and P/S models, across a wide range of US and ASX-listed equities, updated daily.

If you’re setting a long-term revenue growth assumption for a public comparable or a company you’re modeling against, the intrinsic value calculator gives you a fair-value range built on the same DCF and multiples logic institutional analysts use, which is a fast way to check whether your growth driver is in line with what the market is actually pricing. Pair that with the CAGR calculator to convert historical performance into a growth rate you can stress-test against your own bottom-up number. Run your next scenario range through Tickerplace’s intrinsic value tools before you lock your upside case, and see whether the market agrees with your assumptions.
Sources
For deeper technique detail, Corporate Finance Institute’s forecasting guide covers time-series methods, regression, and Monte Carlo with an analyst’s level of rigor. Harvard Business School Online’s breakdown of forecasting methods is a strong primer on pro forma statements and the quantitative/qualitative split. CFA Institute’s refresher reading on company analysis and forecasting is the closest thing to an industry standard on choosing forecast objects and scenario reconciliation. For B2B pipeline mechanics specifically, Ziellab’s practitioner guide to revenue forecasting models walks through the close-rate calculation in detail, and Spicalo’s research on revenue architecture is worth a look for teams building out pipeline governance.
- Forecasting techniques for financial analysts — Corporate Finance Institute
- Financial forecasting methods — Harvard Business School (HBS) Online blog
- Company analysis & forecasting — CFA Institute
- Revenue forecasting: 5 quantitative + 3 qualitative methods — Salesforce (AU)
FAQ
What Are the Different Methods Used to Forecast Revenue?
Revenue forecasting methods split into quantitative techniques (straight-line, moving average, exponential smoothing/ETS, regression, Monte Carlo) and qualitative techniques (Delphi, expert opinion, market research). Most reliable forecasts combine both with a pipeline-weighted or cohort-based framework.
What Are the Five Quantitative Forecasting Methods?
The five most commonly cited quantitative methods are straight-line forecasting, moving average, exponential smoothing (including FORECAST.ETS), regression analysis, and Monte Carlo simulation, a breakdown Salesforce uses as a standard checklist.
What Are the Four Main Forecasting Frameworks?
The four most common revenue forecasting frameworks are bottom-up (built from individual deals or units up), top-down (derived from a market or company-level figure), pipeline-weighted (deal value multiplied by historical close rate), and cohort or segment-based (tracked by customer group over time).
What Is a Three-Way Forecast Model?
A three-way forecast links three financial statements together: the income statement, balance sheet, and cash flow statement, so a revenue change flows through to its effect on cash and the balance sheet automatically. It’s distinct from a three-scenario forecast (base, downside, upside), though teams sometimes use the term loosely to mean either.
How Do You Know If a Revenue Forecast Is Accurate Enough?
Accuracy is measured with MAPE (Mean Absolute Percentage Error) by comparing forecasted revenue against actuals over several periods. A MAPE under 10% for a quarterly forecast is generally considered tight, while consistent readings above 20% signal the method or inputs need revisiting.