
DCF for Startups vs. Public Stocks: A Practitioner's Guide

A discounted cash flow model values a publicly listed company by projecting its future free cash flows and discounting them back to present value using a required rate of return, then converting that enterprise value into a per-share estimate. This guide covers DCF analysis for listed, cash-generating equities, not exit-based valuation for private, pre-revenue startups, which relies on very different assumptions and rarely uses a traditional discount rate at all.
Run this workflow correctly and you walk away with three things:
- An intrinsic value per share you can defend line by line
- A sensitivity range showing how that number moves with your assumptions
- A margin of safety that tells you how much cushion you actually have before buying
Key Takeaways
A defensible DCF for a listed stock requires normalized free cash flow, a discount rate matched to the correct cash flow type, and a sensitivity table that exposes how much the result depends on terminal growth assumptions.
| Point | Details |
|---|---|
| Match cash flow to discount rate | Use FCFF with WACC or FCFE with cost of equity, never mixed. |
| Normalize before forecasting | Strip one-off items from starting FCF so the forecast isn’t built on a distorted base year. |
| Stress-test terminal value | Terminal value often drives most of total DCF value, so run a WACC × growth sensitivity table before trusting the output. |
| Bridge to equity carefully | Adjust for net debt, minority interests, and share count before dividing by shares outstanding. |
| Use Tickerplace as a starting benchmark | Pull daily-updated intrinsic value estimates and financials, then build your own sensitivity table on top. |
This article is general information, not a substitute for advice from a qualified financial advisor. Consult a qualified financial professional about your own circumstances before acting on anything here.
What Is the DCF Workflow for Valuing a Stock?
Building a usable DCF for a stock comes down to six steps, done in order, each one feeding the next.
- Pick FCFF as your default cash flow measure. Free cash flow to the firm, discounted at the weighted average cost of capital, is the standard approach for most equity investors because it sidesteps capital-structure noise. Use FCFE and cost of equity only when you’re specifically valuing equity claims in a company with unusually stable leverage.
- Normalize starting free cash flow. Strip out one-off tax benefits, litigation settlements, or unusual working-capital swings before you build a forecast on top of that number.
- Forecast a period of several years explicitly. Tie growth to real revenue drivers (unit volume, pricing, margin trajectory) rather than a flat percentage pulled from thin air.
- Calculate terminal value using the Gordon growth model. Justify your terminal growth rate against long-run economic reality, not wishful thinking.
- Discount everything back and bridge to equity value. Add cash and investments, subtract total debt and minority interests, then divide by diluted shares outstanding.
- Build a WACC × terminal growth sensitivity table. This step separates a serious model from a spreadsheet that just spits out one comforting number.
Pro Tip: *Build your sensitivity table before you fall in love with your base case.
The WallStreetPrep DCF training breaks this exact sequence down using a full working model, and it’s worth studying if you want to see the mechanics applied to a real income statement rather than a simplified textbook example.
How Do You Get the Inputs Right?
Most DCF errors trace back to sloppy inputs, not bad formulas. Get these right and the model does the rest.
Starting cash flow. Some analysts prefer owner earnings, operating cash flow minus maintenance capex, over a raw free cash flow figure, especially for capital-intensive businesses where growth capex distorts the picture. Document which version you used; a reader (including future you) needs to know whether you netted out expansion spending or not.

Revenue and margin drivers. Model FCF from the ground up: volume growth, pricing power, and where margins land as the business matures, rather than assuming last year’s growth rate persists indefinitely.
Capex and working capital. Separate maintenance capex from growth capex where the filings allow it, and track the change in working capital carefully. A retailer building inventory ahead of a new store rollout will show a temporary FCF dip that has nothing to do with declining fundamentals.
WACC components. Weight equity at market capitalization, not book value, and use market-value debt where possible. Estimate the after-tax cost of debt from the company’s actual borrowing rate and marginal tax rate.
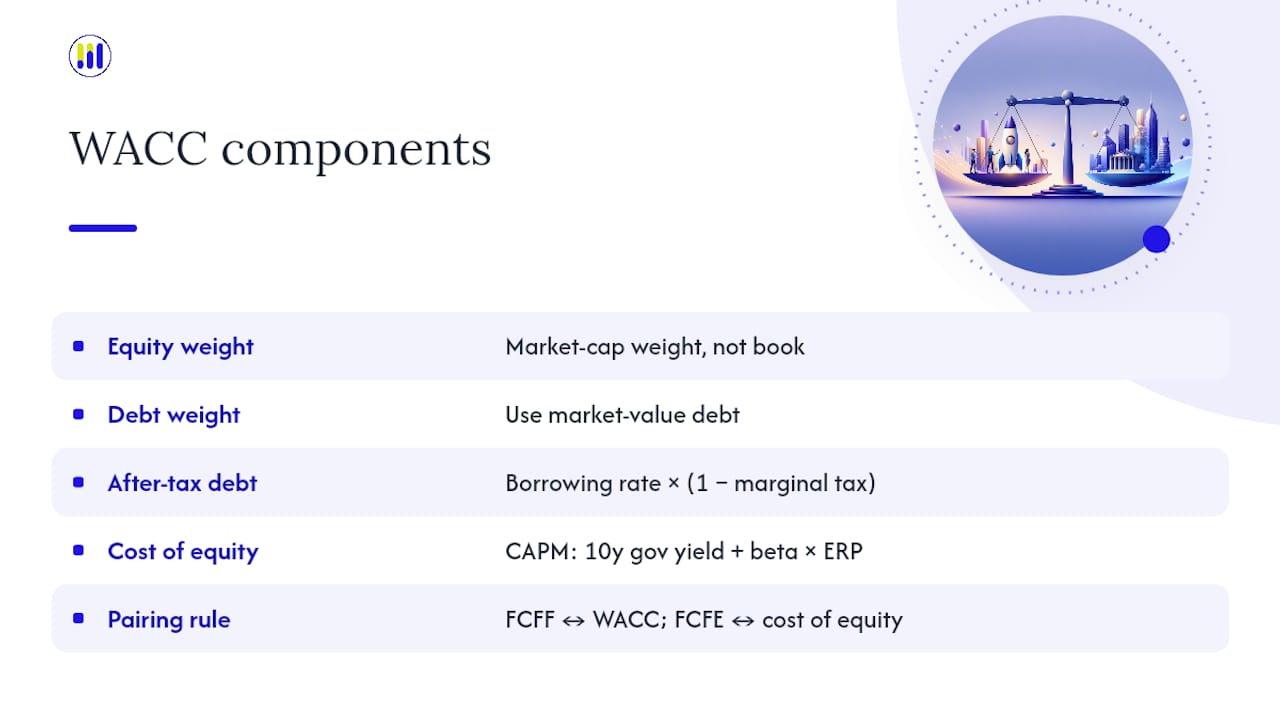
Cost of equity via CAPM. Combine a risk-free rate (typically the 10-year government bond yield), a beta reflecting the stock’s actual volatility relative to the market, and an equity risk premium.
The HBS Online explainer on discounted cash flow makes a point worth repeating here: small shifts in your discount rate can significantly move intrinsic value depending on the company’s growth profile. That’s not a rounding error. It’s the single biggest lever in the entire model, which is exactly why FCFF should always be paired with WACC and FCFE with cost of equity. Damodaran’s valuation framework treats this pairing as non-negotiable, and mismatching the two is one of the more common ways analysts quietly corrupt an otherwise sound model.
Why Does Terminal Value Dominate the DCF Result?
The Gordon growth formula for terminal value is straightforward: final-year free cash flow, multiplied by one plus the long-term growth rate, divided by (WACC minus that growth rate). It looks like a simple ratio, but the denominator is doing almost all the work.
As WACC and terminal growth converge, the denominator shrinks toward zero and terminal value balloons. For most stocks, terminal value ends up representing the majority of total DCF value, sometimes an overwhelming majority, which means your entire fair value estimate can hinge on a single growth assumption for the “rest of forever.”
Anchor your terminal growth rate to long-term nominal GDP growth for mature companies, and rarely push it above that for anything but genuinely dominant, still-expanding franchises. A software company growing revenue 40% a year today cannot sustain that rate into a terminal calculation without implying it eventually swallows the global economy.
A sensitivity table makes the fragility visible instead of hidden inside a single cell:
| WACC \ Terminal Growth | — | — | — |
|---|---|---|---|
| — | Higher value | Higher value | Highest value |
| — | Mid value | Mid value | Higher value |
| — | Lower value | Mid value | Mid value |
Pro Tip: If terminal value forms a large majority of your total DCF value, or your fair value swings dramatically across a normal WACC range, widen your margin of safety before you size a position. Treat that output as a range worth investigating further, not a precise number to bet on.
What Are the Most Common DCF Mistakes?
Four errors show up again and again in retail-built DCF models, and each one is fixable once you know to look for it.
- Using a distorted single-year FCF. A year with a one-time tax refund or an asset sale gets projected forward as if it’s the new normal, inflating every subsequent year in the forecast.
- Mismatching cash flow and discount rate. Discounting FCFE at WACC, or FCFF at cost of equity, systematically biases the output in one direction.
- Under-testing terminal growth and discount rate. A model with no sensitivity table is a model hiding its own fragility.
- Ignoring the equity bridge. Forgetting net debt, minority interests, or a rising share count from stock-based compensation and dilution overstates per-share value, sometimes significantly.
Investopedia’s rundown of DCF pitfalls and Intrinsic Alpha’s analysis of retail valuation errors both point to the same root cause: investors reach for a single confident number instead of a defensible range.
Before trusting any output, run this checklist:
- Normalize starting FCF and note any adjustments you made.
- Confirm your cash flow type matches your discount rate (FCFF with WACC, FCFE with cost of equity).
- Build the WACC × terminal growth sensitivity table.
- Reconstruct the full bridge from enterprise value to per-share equity value.
- Set a margin of safety sized to the company’s uncertainty, wider for volatile growth names, tighter for stable cash generators.
How Can Tickerplace Speed Up Your DCF Workflow?
You don’t need to build every input from a blank spreadsheet. Tickerplace publishes daily-updated, DCF-backed intrinsic value estimates alongside P/E and P/S valuation for thousands of US and ASX-listed companies, giving you a market-checked starting point before you touch a single formula.
- The stock valuation checker flags whether a stock currently screens as overvalued or undervalued relative to its fundamentals.
- Full financial statements per ticker give you the reported FCF, debt, and share count figures you need for normalization and the equity bridge.
- The enterprise value calculator handles the EV-to-equity conversion mechanically once you’ve settled on your own assumptions.
Pull the starting figures from Tickerplace, then build your own explicit forecast and sensitivity table on top of them. That combination is faster than starting cold and more disciplined than trusting a single output blindly.
| Point | Details |
|---|---|
| Starting point vs. final answer | Use Tickerplace’s daily intrinsic value estimates as a benchmark input, then verify with your own forecast. |
| Speed | Financial statements and calculators cut hours off gathering FCF, debt, and share count figures. |
A practitioner’s take on trusting the number
Treat a DCF as a structured argument about a company’s future, not an oracle that spits out truth. At Tickerplace, we build ranges and apply margin-of-safety rules to size positions, because a single point estimate invites false confidence. Tools speed up the arithmetic; judgment still decides what the output means.
Get a fast DCF starting point without the spreadsheet setup
Building a full DCF from scratch takes hours before you even get to the interesting question: is the stock actually cheap? Tickerplace’s intrinsic value calculator shortcuts that setup work, generating a daily-updated fair value estimate for thousands of US and ASX-listed stocks so you can sanity-check your own assumptions against a live benchmark rather than building blind.

Run a ticker through the stock valuation checker to see whether it currently screens as overvalued or undervalued, then pull the underlying financials to normalize your own FCF figure and stress-test it with your own WACC and terminal growth assumptions. If working capital and margin drivers are unfamiliar territory, the partner guide on budgeting fundamentals offers a useful primer on separating durable cash generation from one-off swings. Start with the free calculator, compare it against your model, and decide from there whether the stock earns a place on your watch list.
Sources
FAQ
Is FCFF or FCFE Better for Valuing a Stock?
FCFF discounted at WACC is the more common default because it avoids capital-structure distortions; use FCFE with cost of equity only when you’re specifically isolating equity holder cash flows.
Why Does a Small Change in WACC Move the Valuation So Much?
Terminal value sits in a denominator of (WACC minus terminal growth), so as that gap narrows, terminal value grows disproportionately, dragging the whole valuation with it.
What Terminal Growth Rate Should I Use?
Anchor it to long-term nominal GDP growth for most mature companies, and reserve anything higher for a genuinely dominant business still expanding its addressable market.
Can I Trust a Single DCF Output as My Fair Value Target?
No single point estimate should drive a buy decision; build a sensitivity table and apply a margin of safety, and use a resource like Tickerplace’s intrinsic value calculator to benchmark your own model.
How Do I Adjust a DCF for a Company With Volatile Cash Flows?
Normalize the starting FCF by removing one-time items, build multiple growth scenarios instead of one base case, and widen the margin of safety to reflect the added uncertainty.