
TL;DR:
- Undervalued stocks trade below their estimated intrinsic value, signaling a market mispricing.
- It is essential to combine multiple valuation metrics with qualitative analysis to identify genuine opportunities.
A stock is undervalued when its market price trades below its estimated intrinsic value, signaling that the market has mispriced the business relative to its true worth. Identifying undervalued stocks, known formally as value investing, requires more than a quick glance at a low share price. Metrics like the price-to-earnings (P/E) ratio, price-to-book (P/B) ratio, and EV/EBITDA each reveal a different dimension of value. The most reliable method combines multiple valuation metrics with qualitative analysis of the business itself.
What are the key financial metrics for identifying undervalued stocks?
The P/E ratio is the most widely used starting point for spotting undervaluation. It compares a company’s share price to its earnings per share. A low P/E relative to industry peers suggests the market is paying less for each dollar of earnings, which can indicate undervaluation.
General thresholds help frame your screening. Common benchmarks as of 2026 include:
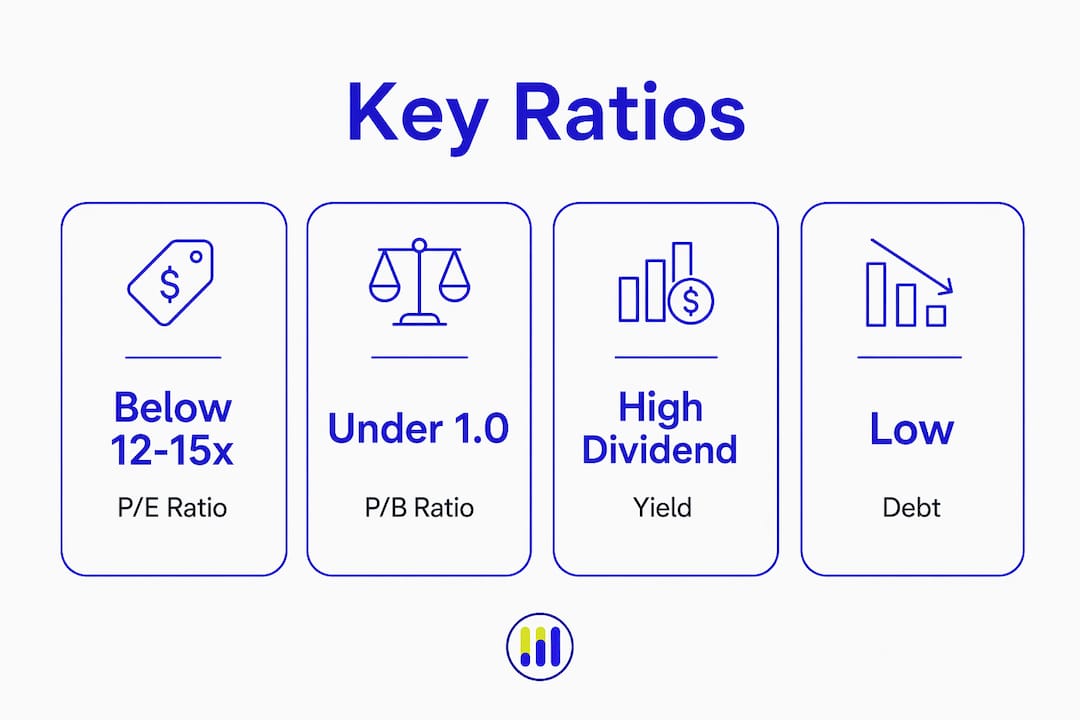
- P/E ratio: below 12–15x signals potential undervaluation
- P/B ratio: below 1.0–1.5x suggests the stock trades near or below book value
- EV/EBITDA: below 8–10x indicates a relatively cheap enterprise value
- Free cash flow yield: above 6–8% points to strong cash generation relative to price
- PEG ratio: below 1.0 accounts for growth, making it useful for growth-oriented value screens
These thresholds are guidelines, not rules. A P/B ratio below 1.0 can signal financial distress or bankruptcy risk just as easily as a bargain. Industry context is non-negotiable when interpreting any ratio.
| Metric | Potential undervaluation threshold | Key caution |
|---|---|---|
| P/E ratio | Below 12–15x | Compare within the same industry |
| P/B ratio | Below 1.0–1.5x | May indicate distress, not value |
| EV/EBITDA | Below 8–10x | Capital-intensive sectors skew higher |
| Free cash flow yield | Above 6–8% | Verify cash flow is recurring |
| PEG ratio | Below 1.0 | Requires reliable growth estimates |

Pro Tip: Never screen on a single ratio. A stock with a low P/E ratio but deteriorating revenue growth can still be a poor investment.
How do you combine ratios with qualitative analysis?
Financial ratios identify candidates. Qualitative analysis confirms whether the discount is real or a warning sign. No single ratio suffices to confirm undervaluation on its own.
Follow these steps to move from screening to conviction:
- Read the 10-K annual report. The 10-K filed with the SEC reveals debt levels, management’s capital allocation decisions, and competitive advantages. Available on SEC.gov and company investor relations pages, it is the most complete picture of business health.
- Assess the balance sheet. Check the debt-to-equity ratio and interest coverage. High debt amplifies risk, particularly when earnings are already under pressure.
- Identify the cause of the discount. Temporary setbacks like a one-time earnings miss or a cyclical downturn can create genuine buying opportunities. Structural decline, such as a business model made obsolete by technology, does not.
- Evaluate management quality. Look at capital allocation history. Managers who consistently buy back stock at high prices or make poor acquisitions destroy value regardless of how cheap the stock looks on paper.
- Assess competitive position. A company with durable pricing power, switching costs, or a strong brand is far more likely to recover from a temporary setback than a commodity business with no differentiation.
Pro Tip: When reviewing a 10-K, focus on the “Risk Factors” and “Management’s Discussion and Analysis” sections first. These reveal how management thinks about the business and what threats they acknowledge.
What tools can investors use to screen for undervalued stocks?
The right tools reduce the time required to move from idea to analysis. Finviz and ScreenerHero expedite finding candidates by filtering for multiple undervaluation metrics simultaneously. Both allow investors to set thresholds for P/E, P/B, and debt-to-equity in a single screen.
Tickerplace takes a different approach. Rather than requiring investors to set manual filters, Tickerplace runs multi-model valuation across 10,000+ US and ASX-listed equities using DCF, P/E, and P/S analysis. The stock valuation checker generates an intrinsic value estimate and a clear overvalued or undervalued signal, updated daily. For investors who want to run their own numbers, the intrinsic value calculator and P/B ratio calculator allow manual inputs for deeper analysis.
Discounted cash flow (DCF) models supplement ratio-based screening by estimating intrinsic value from projected future cash flows. DCF is more sensitive to assumptions, but it forces investors to think explicitly about growth rates and discount rates, which sharpens judgment.
A critical reminder: a low share price alone does not mean a stock is cheap. A $5 stock with a deteriorating business can be expensive. A $500 stock with underestimated future cash flows can be a bargain. Price per share is irrelevant without context.
For investors who lack the time for deep individual stock research, diversified index funds offer broad market exposure without the analytical burden of stock-specific valuation.
What are the common pitfalls when looking for undervalued stocks?
The most dangerous mistake in value investing is confusing a cheap stock with a good investment. A value trap is a stock that looks undervalued by standard metrics but continues to decline because the underlying business is structurally impaired.
Watch for these warning signs:
- Consistently declining revenue over multiple years, not just one bad quarter
- Shrinking margins with no credible path to recovery
- Management credibility issues, including frequent guidance misses or unexplained executive departures
- Unsustainable debt loads that constrain the company’s ability to invest or survive a downturn
- No plausible turnaround scenario. A temporary problem must have a realistic path to resolution to justify buying the discount.
“Value stocks carry persistent risk of loss despite their appeal. Aligning your time horizon with the realization of intrinsic value is as important as identifying the discount in the first place.” — Fidelity
Value investing requires patience and a long-term commitment. The market does not correct mispricings on a schedule. Investors who buy undervalued stocks expecting a quick rebound frequently sell at a loss before the thesis plays out.
Key Takeaways
Identifying a genuinely undervalued stock requires combining quantitative ratio screening with qualitative business analysis, patience, and a clear understanding of why the discount exists.
| Point | Details |
|---|---|
| Intrinsic value is the benchmark | A stock is undervalued only when its market price falls below its estimated intrinsic value. |
| Use multiple metrics | P/E, P/B, EV/EBITDA, and free cash flow yield each reveal a different dimension of value. |
| Qualitative analysis confirms the thesis | Read the 10-K, assess debt, and identify whether the cause of undervaluation is temporary or structural. |
| Value traps are real | Declining revenue, poor management, and unsustainable debt can make a cheap stock a permanent loss. |
| Patience is required | Market correction to intrinsic value takes time; align your time horizon before you invest. |
Tickerplace’s take on finding undervalued stocks
The most common mistake individual investors make is treating a single ratio as a verdict. A low P/E is a question, not an answer. The answer comes from understanding why the ratio is low and whether the business has the capacity to recover.
At Tickerplace, we see investors fixate on share price rather than value. A stock trading at $8 is not automatically cheap, and a stock at $400 is not automatically expensive. What matters is the relationship between price and the present value of future cash flows. That relationship is what every valuation model, from DCF to P/E multiples, is trying to estimate.
The discipline that separates successful value investors from the rest is not superior stock-picking ability. It is the willingness to hold a position through short-term noise when the underlying thesis remains intact. Combine that patience with rigorous quantitative screening and honest qualitative assessment, and the odds shift meaningfully in your favor.
— Tickerplace
Put these methods to work with Tickerplace
Tickerplace gives individual investors the same valuation depth that institutional analysts use, at no cost.

The stock valuation calculator runs P/E and intrinsic value models side by side, so you can see how different assumptions affect your estimate. The stock valuation checker covers 10,000+ equities across US and ASX markets, generating a daily overvalued or undervalued signal based on multi-model analysis. If you are building a position over time, the average price calculator tracks your cost basis as you add shares. All tools are free. No subscription required.
FAQ
What does it mean for a stock to be undervalued?
A stock is undervalued when its current market price is lower than its estimated intrinsic value. This gap signals a potential buying opportunity for investors who believe the market has mispriced the business.
What is a good P/E ratio for an undervalued stock?
A P/E ratio below 12–15x is a common threshold for undervaluation, though the appropriate benchmark varies by industry. Always compare a company’s P/E to its sector peers rather than the broad market average.
What is the difference between an undervalued stock and a value trap?
An undervalued stock has a temporary discount with a plausible recovery path. A value trap appears cheap by standard metrics but continues to decline because of structural business problems, such as obsolete products or unsustainable debt.
How do I evaluate stock value beyond financial ratios?
Read the company’s 10-K annual report to assess debt levels, management quality, and competitive position. Qualitative factors like business model durability and management track record determine whether a low ratio reflects genuine value or genuine risk.
Is a low share price the same as an undervalued stock?
No. A low share price does not indicate undervaluation. A $5 stock with deteriorating fundamentals can be expensive, while a $500 stock with underestimated cash flows can be a genuine bargain.