
What Is Market Sentiment? A Guide for Traders and Investors
Market sentiment is the collective mood of investors toward a stock, sector, or the broader market. It reflects whether the crowd leans bullish or bearish about future prices, independent of what a company’s earnings or balance sheet actually say.
Three things matter most as you read the rest of this guide:
- Sentiment drives short-term price swings more than it drives long-term value.
- Extreme optimism or pessimism often signals a reversal is close, which is why professionals treat sentiment extremes as contrarian indicators.
- Sentiment should confirm a decision, not replace risk management like position sizing and stop-losses.
Want a quick gut check right now? Pull up the CBOE VIX or check a broker’s live client-sentiment snapshot. Either one tells you, in seconds, whether the crowd around you is nervous or complacent.
Key Takeaways
Reading market sentiment correctly means combining at least two indicator types with a fundamental valuation check before sizing any trade.
| Point | Details |
|---|---|
| Sentiment is short-term mood | It reflects crowd psychology and positioning, not a company’s actual worth. |
| Extremes often reverse | A very high VIX or lopsided put/call ratio frequently precedes a shift in direction. |
| Combine indicators | Pair a volatility measure like the VIX with a breadth measure like the advance–decline line. |
| Sentiment confirms, it doesn’t decide | Use sentiment to adjust size and stops, not to replace a valuation-based thesis. |
| Verify with valuation tools | Tickerplace’s multi-model valuation checker helps confirm whether a sentiment-driven move is backed by fundamentals. |
Understanding Market Sentiment and Why It Moves Markets
Market sentiment measures expectations, not facts. It captures how investors feel about where prices are headed, shaped by news flow, positioning, available liquidity, and the behavioral biases that make crowds overreact in both directions.
That’s different from what a company is actually worth. A useful way to frame it: markets act like a voting machine in the short run and a weighing machine in the long run. In the short run, a stock can rip 15% on a rumor with no change to its cash flows. Over years, though, price tends to converge with earnings power and free cash flow. A trader watching sentiment cares about the vote count today; a long-term investor cares about the weight of the business over time. Confusing the two timeframes is where most retail mistakes start.
What Are the Main Market Sentiment Indicators?
Professional desks don’t guess at sentiment. They track a specific set of indicators, and each one measures a different slice of crowd behavior.
- CBOE VIX: Often called the “fear gauge,” it measures expected S&P 500 volatility over the next 30 days. Higher readings generally signal increased fear; lower readings generally signal increased complacency.
- Put/call ratio: Compares the volume of bearish put options to bullish call options. A ratio well above 1.0 suggests heavy hedging or bearishness; a very low ratio suggests excessive optimism.
- Advance–decline line: Tracks the number of advancing stocks minus declining stocks, a core measure of market breadth. A rising index price with a falling advance–decline line often means the rally is narrow and fragile.
- New highs vs. new lows: A widening gap toward new highs signals broad strength; a shift toward new lows even as the index holds up is an early warning sign.
- Short interest and margin debt: Rising short interest shows growing bearish bets; rising margin debt shows leveraged optimism, which can amplify a downturn if sentiment flips.
- Survey measures: Consumer and investor surveys, such as the Westpac–Melbourne Institute Consumer Sentiment Index, capture household mood and often move ahead of spending and market data.
- Google Trends: Spikes in searches for terms like “stock market crash” or a specific ticker often coincide with sentiment extremes, giving a free, real-time crowd read.
- Broker client sentiment: Tools that show the percentage of a broker’s clients positioned long versus short on a given instrument, offering a direct look at retail positioning.
Combining signals sharpens the read. A VIX spike above 30 alongside a sharply widening advance–decline decline often flags a heightened risk of a short-term reversal. A rising put/call ratio while new lows are expanding indicates broadening fear across the market, not confined to one sector. Conversely, a low VIX paired with narrowing breadth (fewer stocks participating in a rally) often precedes a pullback, even when headlines stay upbeat.
Pro Tip: Weight breadth indicators more heavily for swing and position trades measured in weeks, and weight volatility measures like the VIX more heavily for anything you’re holding overnight or shorter. Breadth reveals the underlying health of a move; volatility reveals near-term panic risk.
Where Can You Check Market Sentiment in Real Time?
You don’t need an institutional terminal to see what professional desks see. Most of these indicators are free and update throughout the trading day.
- CBOE VIX charts: Available on the CBOE’s own site and most brokerage platforms, updated live during market hours.
- Broker client-sentiment tools: Platforms like IG’s client sentiment tool show real positioning across major currency pairs, indices, and commodities.
- Google Trends: Free and instant, though it works best as a confirming signal rather than a standalone one, since search spikes lag actual price moves.
- Advance–decline and new highs/new lows charts: Published daily by major exchanges and most charting platforms.
- Consumer sentiment surveys: The Westpac–Melbourne Institute survey and similar national surveys update monthly and offer a macro backdrop for equity sentiment.
- News-sentiment feeds: Increasingly built into brokerage and data platforms, scoring headlines for tone in real time.
The common pitfall is checking one tool in isolation. A VIX reading alone tells you volatility expectations are rising, but not whether that fear is broad-based or concentrated in one sector.
Pro Tip: Pair a volatility reading (VIX) with a breadth reading (advance–decline) before drawing any conclusion. Volatility without context tells you the crowd is nervous; volatility with breadth tells you whether that nervousness is spreading or isolated.
How Do Traders and Investors Actually Use Sentiment?
Sentiment works best as a confirmatory signal, not a standalone trigger. Pair it with a technical setup or a fundamental valuation check before acting, and let extreme readings adjust your position size rather than your conviction alone.
- Treat sentiment extremes as a reason to tighten stops or reduce size, not to abandon a thesis outright.
- Tie stop-loss placement to current volatility. A VIX near 30 calls for wider stops than a VIX near 13.
- Day traders lean on intraday put/call shifts and VIX spikes; swing traders weight breadth and short interest over days to weeks; long-term investors mostly ignore sentiment except at true extremes.
Here’s a concrete example: a trader notices a stock has rallied strongly while the put/call ratio for that name has dropped to a very low level, signaling almost universal bullishness. Rather than chasing the breakout, the trader waits for a pullback or trims planned position size, recognizing that one-sided sentiment often precedes a sharp reversal once new buyers run out.
What Mistakes Do People Make With Sentiment Indicators?
The biggest mistake is overreliance on a single indicator, mistaking one noisy data point for a full picture. Diversify across at least two or three signal types (volatility, breadth, and positioning) before drawing a conclusion.
Persistent extremes also trip people up. A market can stay “overbought” by sentiment measures for months, so treat extremes as raising probability, not certainty. Confirm with volume and price action before sizing a trade around sentiment alone. Ignoring liquidity and news catalysts is another common error. Sentiment can flip in minutes around an earnings surprise or a central bank decision, so extremes are not predictive on their own.
A Practical Checklist for Applying Market Sentiment
- Check volatility (VIX) and breadth (advance–decline) together for the current market backdrop.
- Confirm with broker client sentiment and a Google Trends search on the relevant ticker or theme.
- Cross-check against fundamentals with an intrinsic value estimate before acting on the signal.
- Set position size and stop levels based on current volatility conditions.
- Log the setup, the sentiment readings, and the outcome for later review.
Reviewing your logged trades every month is what turns sentiment reading from guesswork into a repeatable process.
Sentiment vs. Fundamentals: Why You Need Both
Sentiment tells you how the crowd feels right now. Valuation tells you what a business is actually worth based on its cash flows, earnings, and growth. Combining both filters out impulsive trades driven purely by crowd mood, since a valuation check gives you an anchor sentiment alone can’t provide.
- Extreme bullish sentiment on a stock trading well above its intrinsic value estimate is a signal to wait or size smaller, not to chase.
- A multi-model valuation approach, using DCF, P/E, and P/S together, acts as a second check before you act on any sentiment-driven idea.
- When sentiment and valuation agree (bearish mood plus genuine undervaluation, for example), the signal carries far more weight than either measure alone.
A Balanced View on Reading the Crowd
Sentiment is a tool for timing entries and managing risk, never a substitute for knowing what something is worth. Use it, log your results honestly, and let the pattern of outcomes, not any single signal, refine how you weight it going forward.
Pairing Sentiment Signals With a Real Valuation Check
Spotting an extreme in the VIX or a lopsided put/call ratio tells you the crowd’s mood. It doesn’t tell you whether the stock in front of you is actually cheap or expensive.
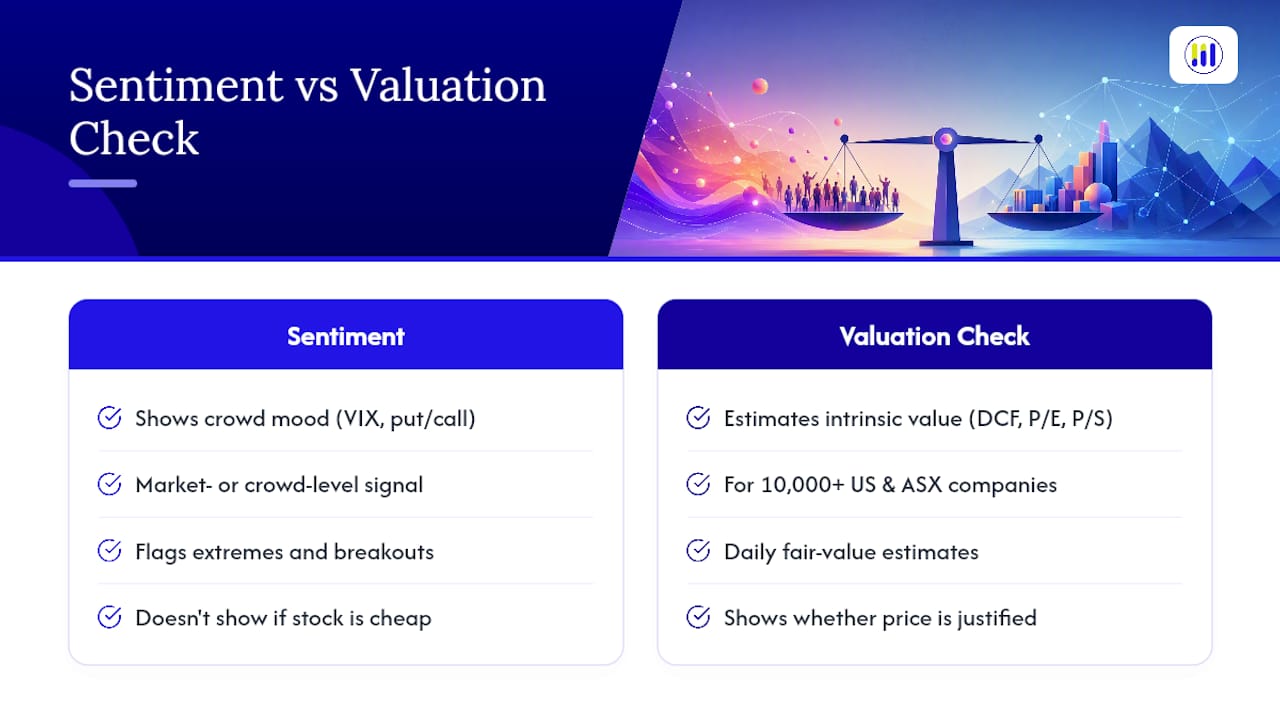
That’s the gap Tickerplace closes. Its stock valuation checker runs DCF, P/E, and P/S models together to produce a daily fair value estimate for more than 10,000 US and ASX-listed companies, free to use. Instead of guessing whether a sentiment-driven breakout is justified, you can pull up the ticker, compare price against intrinsic value, and decide whether the crowd’s optimism (or panic) actually lines up with the fundamentals. Run your next sentiment-flagged idea through the intrinsic value calculator before you size the trade.
Sources
- Market sentiment
- What is market sentiment and how do you trade it? | IG International
- Markets are a voting machine; investing is a weighing machine (Robeco insight)
This article is general information, not a substitute for advice from a qualified financial advisor. Consult a qualified financial professional about your own circumstances before acting on anything here.
FAQ
Is Market Sentiment Bullish or Bearish Right Now?
Sentiment shifts daily and has no fixed state. Check a live source like the CBOE VIX or a broker’s client-sentiment tool for the current reading rather than relying on a fixed answer.
How Do You Use Market Sentiment in Forex Trading?
Forex traders watch broker client-sentiment tools, such as IG’s positioning data, alongside volatility measures to spot when a currency pair is overcrowded on one side of the trade.
Can Market Sentiment Predict a Reversal?
Extreme sentiment readings raise the probability of a reversal but don’t guarantee timing, since extremes can persist for weeks before prices actually turn.
What’s the Difference Between Market Sentiment and Fundamentals?
Sentiment reflects crowd mood and short-term positioning, while fundamentals reflect a company’s actual earnings, cash flow, and intrinsic value. Long-term price tends to follow fundamentals even when sentiment swings widely in the short run.
Should Beginners Rely on Sentiment Indicators Alone?
No. Sentiment works best paired with technical or fundamental analysis, since using it in isolation tends to produce false signals during persistent trends.