
Share Float Explained: What Every Investor Should Know

TL;DR:
- Share float is the number of a company’s shares available for public trading, influencing liquidity and price stability. A low float can cause dramatic price swings, while a high float supports steadier trading and narrower spreads; understanding this helps manage trading risks and expectations. Combining float data with valuation metrics provides a more comprehensive picture before making investment decisions.
Share float is the number of a company’s shares that are actually available for public trading. The formula is straightforward: float = total shares outstanding − restricted and closely held shares. That single number tells you how much tradable supply exists in the market at any given moment, and it has direct consequences for liquidity, price volatility, and your ability to enter or exit a position efficiently. The SEC uses a closely related concept, public float, in regulatory filings and IPO calculations; the S&P applies a free-float methodology to weight index constituents; and platforms like Tickerplace incorporate float data alongside valuation metrics so investors can assess both price and tradability together.
Why does this matter to you? A stock with a small float can move dramatically on modest volume, creating both opportunity and risk. A large float generally means more stable price action and tighter bid-ask spreads, which makes execution more predictable. Understanding float before you place a trade is one of the simplest ways to calibrate your expectations about how a stock will behave.
- Share float = shares outstanding − restricted/closely held shares
- Float percentage = float ÷ shares outstanding (expressed as a percentage)
- Practical takeaway: Low float amplifies volatility; high float supports liquidity and tighter spreads
How share float differs from shares outstanding, authorized shares, and market cap
These terms appear together constantly in financial data, and confusing them leads to real analytical errors.
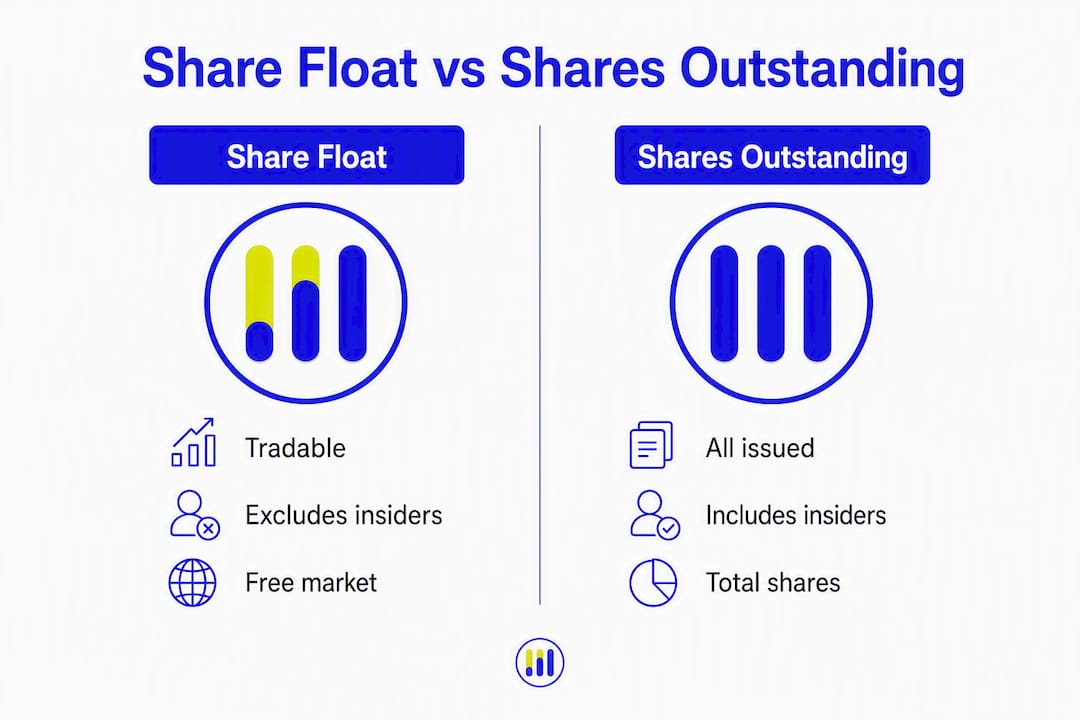
Authorized shares are the maximum number of shares a company is legally permitted to issue, as defined in its corporate charter. Most companies never issue all of them. Shares outstanding are the shares actually issued and held by all stockholders, including executives, directors, large institutional holders, and the public. Floating stock is the narrower subset: only the shares available for open-market trading after removing restricted and closely held positions.
A quick numeric illustration makes the distinction concrete. Suppose a company has a certain number of shares outstanding. Some of these are held by the founding CEO under a lock-up agreement, and some are treasury shares the company repurchased. The float is the remainder of shares available for trading after subtracting restricted and treasury shares.
Market capitalization is typically calculated as share price × shares outstanding. But free-float market cap uses share price × float instead, which gives a better picture of the market value that public investors actually attribute to the company. Index providers like S&P use free-float methodology precisely because it reflects the investable portion of a company’s equity, not the total equity on paper.
Here is how the three share counts compare across key dimensions:
| Dimension | Authorized Shares | Shares Outstanding | Share Float |
|---|---|---|---|
| Includes unissued shares | Yes | No | No |
| Includes insider holdings | N/A | Yes | No |
| Includes treasury stock | N/A | Yes | No |
| Includes restricted stock | N/A | Yes | No |
| Reflects tradable supply | No | No | Yes |
| Used in free-float market cap | No | No | Yes |
Which shares get subtracted when you calculate float
Not every share held outside the open market is automatically excluded from float. The categories below are the ones investors and data providers typically remove.
- Insider and affiliate holdings: Shares owned by officers, directors, and anyone who controls 10% or more of the company. These individuals are classified as affiliates under SEC rules, and their shares are generally treated as restricted unless sold under a registered offering or Rule 144.
- Restricted stock units (RSUs) and unvested equity awards: Shares granted to employees that have not yet vested. Until vesting occurs and any lock-up period expires, these shares cannot be freely traded and are excluded from float.
- Lock-up shares: After an IPO or secondary offering, underwriters typically impose a lock-up period (commonly 90–180 days) during which insiders and early investors cannot sell. Shares subject to an active lock-up are not part of the float.
- Treasury stock: Shares the company has repurchased and holds on its own balance sheet. These shares are not outstanding in any tradable sense and are always excluded.
- Closely held blocks: Large long-term shareholders, such as founding families or strategic partners, who hold shares with no apparent intention to trade. Data providers often exclude these when the holder’s position is large and stable.
One important caveat: a large shareholder who actively trades their position can blur the line. If a 12% holder regularly sells shares into the market, some data providers may treat a portion of that block as float. This is one reason float figures can vary across sources, and why checking the methodology of your data provider matters.
How to calculate float and float percentage, step by step
The calculation itself is simple once you have the right inputs. Here is the process:
- Find total shares outstanding. The most reliable source is the company’s most recent SEC Form 10-Q (quarterly) or Form 10-K (annual). The cover page of each filing states the shares outstanding as of a specific date.
- Identify restricted and closely held shares. Look at the insider ownership table in the proxy statement (DEF 14A) or the beneficial ownership section of the 10-K. Note shares held by officers, directors, and 10%-plus holders. Also check for RSU and lock-up disclosures in the notes to financial statements.
- Subtract to get float. Float = shares outstanding − restricted/closely held shares. Per Investopedia’s float definition, float will always be less than or equal to shares outstanding.
- Compute float percentage. Float percentage = float ÷ shares outstanding × 100. A low float percentage signals that insiders or large holders control a significant portion of the company, reducing the tradable supply available to the public.
Worked example:
- Shares outstanding: 20,000,000
- CEO and directors hold: 3,000,000
- Unvested RSUs (lock-up active): 500,000
- Treasury shares: 200,000
- Float: 20,000,000 − 3,700,000 = 16,300,000 shares
- Float percentage: 16,300,000 ÷ 20,000,000 = 81.5%
Statistic callout: Float percentage reveals ownership concentration. A float percentage below 20% typically indicates that insiders or large holders control the vast majority of equity, which can severely limit market liquidity and amplify price swings on modest volume.
One critical point: float changes only when corporate actions alter tradable shares. Secondary offerings increase float; buybacks and lock-up agreements reduce it. Daily trading activity does not change float at all. Always note the date of the float figure you are using and check whether any major corporate actions have occurred since that date.

Why float matters for liquidity, volatility, and trading risk
Float is one of the most direct indicators of how a stock will behave in the market. The relationship between float size and price behavior is not subtle.
- Liquidity: A smaller float means fewer shares are available to absorb buy and sell orders. When demand spikes, there are simply not enough shares to go around, which pushes prices up sharply. Conversely, a wave of selling in a low-float stock can crater the price quickly.
- Volatility: Low-float stocks are highly sensitive to demand shifts and can experience extreme price swings during earnings releases, news events, or broader market moves. High-float stocks tend to absorb the same volume without the same magnitude of price movement.
- Bid-ask spreads: Thin float usually means thinner order books and wider bid-ask spreads. That spread is a real cost every time you trade. In a high-float, liquid stock, spreads are often a penny or two; in a low-float name, they can be a dime or more.
- Short squeeze risk: When a low-float stock also carries high short interest, the conditions for a short squeeze are present. Short sellers need to buy shares to cover their positions, but with limited float available, covering demand can drive prices up rapidly, forcing more covering in a feedback loop. This dynamic is well-documented in low-float names with high short interest.
- Manipulation risk: A small tradable supply makes it easier for a concentrated group of buyers to move the price, which is why low-float stocks appear more frequently in pump-and-dump schemes and other forms of price manipulation.
Pro Tip: When trading a low-float stock, calculate the float-to-average-daily-volume ratio. If a stock’s average daily volume equals 20% or more of its float, expect significant intraday volatility. Size your position accordingly and set stop orders before you enter, not after the move has started. You can also review stock volatility fundamentals to understand the broader drivers at work.
What traders mean by “low float” and “high float,” and the caveats
The ranges traders use are informal conventions, not regulatory thresholds. Knowing them helps you follow market conversations, but applying them mechanically is a mistake.
- Low float: Commonly defined as stocks with a relatively small number of shares available for trading; these stocks can experience large percentage moves in a single session on heavy volume.
- Medium float: Stocks with a moderate number of shares available for trading, more stable than low-float names but still capable of sharp moves on significant news.
- High float: Stocks with a large number of shares available for trading, generally associated with large-cap companies, institutional ownership, and predictable execution.
These cutoffs are heuristic, not regulatory, and context matters enormously. A stock trading at $200 per share with 8 million float shares has a very different liquidity profile than a $2 stock with the same float count, because the dollar value of the tradable supply differs by a factor of 100. Similarly, a company with 9 million float shares but $500 million in average daily dollar volume is far more liquid than one with 50 million float shares and almost no institutional interest.
The most important caveat: low float does not automatically mean a good trading opportunity. Institutions often avoid very low-float stocks because slippage and liquidity risk make meaningful position sizes impractical. Retail traders who chase low-float momentum without accounting for exit liquidity frequently find that getting out is far harder than getting in.
Where to find and verify a company’s float in the U.S.
Reliable float data requires cross-referencing primary filings with data providers. Here is a practical verification workflow:
- Pull the latest SEC Form 10-Q or 10-K. The cover page states shares outstanding as of a specific date. This is your starting point. Access filings directly through the SEC’s EDGAR database at sec.gov.
- Check the proxy statement (DEF 14A) or beneficial ownership tables. These disclose shares held by officers, directors, and 5%-plus holders. Add up the restricted positions to subtract from outstanding shares.
- Look for RSU and lock-up disclosures. The notes to financial statements in the 10-K or 10-Q will describe equity compensation plans and any active lock-up agreements from recent offerings.
- Cross-reference with major data providers. NASDAQ’s company profile pages display float figures. Yahoo Finance shows float under the “Statistics” tab for each ticker. Bloomberg Terminal users can pull float data with the FLOAT function. These figures are calculated by the provider’s methodology, so small discrepancies across sources are normal.
- Note the date of the figure. Float data from a provider may lag the most recent filing by days or weeks. After a secondary offering, buyback, or lock-up expiration, the provider’s figure may not yet reflect the change.
The SEC’s public float concept is the authoritative U.S. definition used in regulatory filings and IPO prospectuses. For index-related float, the S&P’s free-float methodology is the standard reference for understanding how float affects index weighting and free-float market cap calculations.
Practical trading rules for low-float versus high-float stocks
Float size should directly influence your order type, position size, and risk management approach. The rules differ meaningfully between the two ends of the spectrum.
For low-float stocks:
- Use limit orders exclusively. Market orders in thin float can fill at prices far from the quoted price, especially during fast-moving sessions.
- Reduce position size relative to your normal sizing. A position that represents 0.5% of your portfolio in a high-float stock may represent 5% of the daily float in a low-float name, making your own trades a price-moving factor.
- Watch the float-to-average-daily-volume ratio. When daily volume regularly exceeds 50% of float, the stock is in a high-activity regime and spreads can widen dramatically.
- Plan your exit before you enter. Low-float stocks can reverse as fast as they move. Knowing your exit price in advance prevents emotional decision-making during a rapid move.
- Monitor short interest relative to float. High short interest in a low-float name is a potential squeeze setup, but it is also a warning that many sophisticated traders are betting against the stock.
For high-float stocks:
- Market orders are generally acceptable for liquid names with narrow spreads, though limit orders are still preferable for larger positions.
- Position sizing can be more conventional because your order is unlikely to move the market.
- Focus more on valuation and fundamentals, since price action is less distorted by supply constraints.
Pro Tip: Experienced traders often reserve low-float names for small, speculative positions and use high-float stocks for their core holdings where predictable execution matters. If you are optimizing your trading workflow, categorizing your watchlist by float tier before market open helps you set the right order type and size for each name before the session starts.
Two worked examples: float calculation and trading impact
Example A: Calculating float from SEC data
| Item | Shares |
|---|---|
| Shares outstanding (from 10-K) | a specified total |
| CEO and director holdings | a portion of shares |
| Unvested RSUs (lock-up active) | some restricted shares |
| Treasury shares | shares held by company |
| Float | calculated as outstanding minus restricted and treasury shares |
| Float percentage | ratio of float to shares outstanding expressed as a percentage |
This company has a high float percentage, meaning a large portion of its equity is freely tradable. Institutional investors can build meaningful positions without moving the price significantly, and bid-ask spreads are likely to be tight.
Example B: Trading impact of a small float
| Item | Shares |
|---|---|
| Shares outstanding | a moderate total number |
| Insider and restricted holdings | a significant portion of shares |
| Float | remaining shares after subtracting restricted shares |
| Float percentage | ratio of float to shares outstanding expressed as a percentage |
With a relatively small float, a large institutional order can represent a substantial portion of the tradable supply. If such an order hits the market during a news catalyst, the price impact can be severe. Slippage on entry and exit becomes a significant cost, and the stock becomes vulnerable to squeeze dynamics if short interest is elevated. You can check trending stocks by volume to see real-time examples of how float interacts with volume spikes in the current market.
- Key difference: Example A’s 80% float percentage supports stable, predictable trading. Example B’s 30% float percentage creates a supply-constrained environment where demand shocks produce outsized price moves.
- Practical implication: In Example B, a trader using a market order during a fast move could pay 5–10% above the quoted price. In Example A, the same order would likely fill within a few cents of the quote.
How to combine float with valuation metrics using Tickerplace
Float tells you about tradability; valuation tells you about price relative to intrinsic worth. Using both together gives you a more complete picture before committing capital.
Here is a practical workflow:
- Find the float and float percentage for your target stock using SEC filings or a data provider, as described above.
- Assess the float percentage in context. A float below 30% warrants extra caution about liquidity and price manipulation risk, regardless of how attractive the valuation looks.
- Compare float to average daily volume. If average daily volume is less than 1% of float, the stock is thinly traded even by its own historical standards.
- Run a valuation check on Tickerplace. Use the stock valuation calculator to generate P/E and intrinsic value estimates. A stock that looks undervalued on a DCF basis but has a 15% float percentage may be cheap for a reason: the limited tradable supply makes it difficult for the market to efficiently price in new information.
- Consider free-float market cap versus outstanding-based market cap. If insiders hold 60% of shares, the outstanding-based market cap overstates the market value that public investors are actually assigning to the company. Free-float market cap, calculated as price × float, gives a more accurate reflection of public market value.
- Size your position based on both float and valuation margin of safety. A wide margin of safety does not compensate for a stock so thinly traded that you cannot exit without moving the price against yourself.
If you do not yet have access to Tickerplace, the same steps apply using public data from SEC EDGAR, Yahoo Finance, and NASDAQ. Tickerplace consolidates these inputs into a single workflow, which reduces the time spent cross-referencing multiple sources.
Key Takeaways
Share float is the single most direct measure of how much tradable supply exists in a stock, and combining it with volume, valuation, and corporate action history gives investors a far more complete picture than price alone.
| Point | Details |
|---|---|
| Float definition | Float = shares outstanding − restricted and closely held shares; always less than or equal to outstanding shares. |
| Float percentage | Float ÷ shares outstanding; a low percentage signals high insider concentration and reduced tradable supply. |
| Low vs. high float | A stock is commonly called low float if fewer than 10 million shares are available for public trading, and high float if more than 100 million shares are available. However, context—price, volume, market cap—determines what those numbers mean in practice. |
| Trading implications | Low float amplifies volatility, widens spreads, and raises squeeze risk; use limit orders and reduce position size accordingly. |
| Tickerplace workflow | Combine float data with P/E and intrinsic value checks on Tickerplace to assess both tradability and valuation before entering a position. |
Float matters more than most investors realize
The conventional wisdom treats float as a secondary data point, something you glance at after you have already decided you like a stock. That ordering is backwards. Float should be one of the first filters you apply, because it determines whether the stock is even tradable at your intended size.
The mistake seen most often is investors who identify a genuinely undervalued small-cap, build a thesis, and then discover after entering that the float is so thin that any attempt to exit a meaningful position moves the price against them. The valuation was right; the liquidity analysis was skipped. Float does not make a bad company good or a good company bad, but it absolutely determines whether your thesis can be expressed efficiently in the market.
One corrective action: before you research a company’s financials, check its float and float-to-average-daily-volume ratio first. If those numbers disqualify the stock for your position size, you have saved yourself hours of analysis on a name you cannot trade properly. If they pass, proceed with the full research process, and revisit the float figure after any major corporate action.
Tickerplace brings float and valuation together in one place
Float analysis is most useful when it sits alongside valuation data, not in a separate tab or spreadsheet. Tickerplace is a free stock valuation platform that gives individual investors institutional-grade tools without the institutional price tag, covering 10,000+ U.S. and ASX-listed equities with daily-updated intrinsic value estimates, P/E and DCF analysis, and side-by-side stock comparison.

For investors working through the float-plus-valuation workflow described in this article, the stock valuation checker gives you a fast read on whether a stock is overvalued or undervalued, and the intrinsic value calculator lets you model fair value estimates directly. This article is published by Tickerplace as part of its investor education series. Start with a free account and run your first valuation check in under two minutes.
Useful sources for verifying float data
Primary U.S. sources:
- SEC EDGAR (sec.gov): The authoritative source for shares outstanding (Form 10-K and 10-Q cover pages) and insider holdings (DEF 14A proxy statements and beneficial ownership tables). Always use the most recent filing and note the “as of” date.
- Company investor relations pages: Many companies publish current share counts and insider ownership summaries directly on their IR sites, sometimes more current than the latest SEC filing.
- NASDAQ company profiles: Display float figures alongside shares outstanding and institutional ownership data. Useful for a quick cross-reference.
- Yahoo Finance (Statistics tab): Shows float, shares outstanding, and short interest as a percentage of float. Methodology may differ slightly from NASDAQ, so discrepancies of a few percent are normal.
Index and methodology references:
- S&P free-float methodology: The S&P 500 and related indexes use free-float adjusted market caps to weight constituents. Understanding this methodology explains why a company’s index weight can differ from its share of total market cap.
- Corporate Finance Institute free-float guide: A clear explanation of how free-float market cap is calculated and why it differs from outstanding-based market cap.
Verification checklist:
- Confirm the date of the float figure you are using. Float data can lag corporate actions by days or weeks.
- Cross-reference at least two providers (e.g., NASDAQ and Yahoo Finance) and investigate any discrepancy larger than 5%.
- After any secondary offering, buyback announcement, or lock-up expiration, re-pull the float figure before trading. Corporate actions can materially change a company’s float and its liquidity profile almost overnight.
- For companies with complex equity structures (multiple share classes, convertible notes, warrants), check whether the provider’s float figure accounts for potential dilution.
FAQ
What is a good share float for a stock?
There is no universally “good” float; it depends on your trading style and position size. High-float stocks (generally above 100 million shares) offer more predictable execution and tighter spreads, making them better suited for larger positions and longer holding periods.
Is high or low float better for trading?
High float is generally better for investors who prioritize execution reliability and lower volatility. Low float suits short-term traders seeking large percentage moves, but it carries significantly higher liquidity and slippage risk.
Is a high free float good or bad for a company?
A high free float is generally positive: it signals broad public ownership, better price discovery, and greater institutional accessibility. It can also reduce the influence of any single insider on the stock price.
What is considered a low share float?
Traders commonly define low float as fewer than 10 million shares available for public trading. The practical impact depends on share price and average daily volume; for instance, a $50 stock with 8 million float shares is far more liquid than a $1 stock with the same float count.
How do I find a stock’s float in the U.S.?
Start with the company’s most recent SEC Form 10-K or 10-Q for shares outstanding, subtract insider and restricted holdings from the proxy statement, then cross-check the result against NASDAQ or Yahoo Finance. Tickerplace also displays key market data alongside valuation metrics for U.S.-listed stocks.