
Stock Liquidity Explained: What Every Investor Should Know

Stock liquidity describes how easily and quickly you can buy or sell shares in the secondary market without substantially moving the price. For a retail investor, that translates directly into two things: how fast you can exit a position and how much that exit actually costs you once spread and slippage are factored in. The key metrics to watch are average daily trading volume (ADTV), bid-ask spread, and market depth. Each one tells you something different about whether your order will fill cleanly or drag against the market.
Key Takeaways
Stock liquidity determines both how quickly you can exit a position and how much that exit costs you in spread and slippage.
| Point | Details |
|---|---|
| Core definition | Liquidity measures how easily shares trade without substantially moving the price. |
| Primary metrics | Check ADTV, bid-ask spread as a percentage of price, and order-book depth before trading. |
| Spread benchmark | Liquid large-cap stocks typically show spreads well under 1%; illiquid names can show spreads of several percent. |
| Order type choice | Use limit orders in thin markets to control price; market orders carry slippage risk in low-liquidity stocks. |
| Position sizing rule | Keep individual orders below 1% of ADTV to minimize market impact; split larger orders into tranches. |
What stock liquidity really means and what drives it
Liquidity is a spectrum, not a binary. Cash sits at the most liquid end; a stake in a private company or a piece of real estate sits near the other. Exchange-listed stocks occupy the middle-to-upper range, though the spread within that category is enormous: a mega-cap S&P 500 component and a thinly traded OTC stock are both technically “stocks,” yet their liquidity profiles are worlds apart.
Two distinct concepts often get conflated here. Accounting liquidity measures whether a company can meet its short-term obligations using current assets. Market liquidity (the focus of this article) measures how easily shares trade in the secondary market. They are related but not the same thing.
The core components that determine market liquidity include:
- Number of active buyers and sellers. More participants means tighter spreads and faster fills. Thin participation is the root cause of most liquidity problems.
- Bid-ask spread. The gap between what buyers will pay and what sellers will accept. A narrow spread signals a competitive, active market.
- Market depth and order-book depth. How many shares are available at each price level above and below the current quote. Depth determines whether a larger order can be absorbed without pushing the price.
- Market makers. Designated or informal participants who continuously quote both a buy and a sell price, providing the baseline liquidity that keeps markets orderly.
- Trading venues and hours. Liquidity concentrates during regular U.S. market hours (9:30 AM to 4:00 PM ET). Pre-market and after-hours sessions carry meaningfully thinner books.
- Slippage. The difference between the price you expected and the price you actually received. Slippage is the hidden tax of illiquid markets.
How to measure liquidity in stocks
Five metrics give you a practical read on how liquid a stock is before you place an order.
| Metric | What it measures | Signal for good liquidity |
|---|---|---|
| Average daily trading volume (ADTV) | Shares traded per day, averaged over 20–30 days | High relative to your intended order size |
| Bid-ask spread | Gap between best bid and best ask | Narrow; just a few pennies for large caps |
| Turnover ratio | Trading volume divided by shares outstanding | Higher ratio indicates active secondary trading |
| Free float | Shares available to the public (excluding insider/restricted holdings) | Larger float supports more consistent liquidity |
| Order-book depth | Cumulative shares available at each price level | Multiple price levels with meaningful size |
According to Wikipedia’s entry on market liquidity, for actively traded large-cap stocks the bid-ask spread is often just a few pennies, well under 1% of the share price. For thinly traded or OTC names, that spread can widen to several percent of the price, turning a routine trade into a costly one before any commission is counted.
One important caveat: a narrow spread alone does not confirm genuine liquidity. FINRA’s investor guidance makes this point clearly: market depth determines whether a larger order can be filled without slippage. A stock can show a tight quoted spread of a few cents while carrying only a few hundred shares at that level. The moment your order exceeds that depth, the price moves against you.
Pro Tip: *Check ADTV relative to your planned order size, not in absolute terms.
Why liquidity matters for your portfolio
Liquidity is a primary risk control, not a secondary consideration. FINRA explains that illiquid securities may force you to accept a lower price or prevent a timely exit altogether. That risk compounds in three specific ways.
Execution cost. Every trade in an illiquid stock costs more than the commission line shows. The spread is paid on entry and again on exit. Add slippage on both legs and a round-trip trade in a thinly traded stock can cost several percent before the position has moved at all.

Exit risk. In a liquid market, you can sell quickly at or near the quoted price. In an illiquid one, you may need to accept a discount to find a buyer, or wait days for enough volume to absorb your position. That waiting period carries its own price risk.
Liquidity changes under stress. Liquidity is not static. News events, earnings releases, and broad market sell-offs can drain liquidity from even moderately active stocks within minutes. After-hours and pre-market sessions are structurally thinner. Investors who rely on being able to exit quickly need to account for the fact that liquidity can disappear precisely when they need it most.
Fidelity’s liquidity guide notes that stocks, ETFs, and large-cap securities are generally more liquid than private assets or small-cap and OTC stocks, and that more buyers and sellers usually makes selling easier. That observation holds in normal conditions; the stress caveat is what separates experienced investors from beginners.
A practical checklist before you buy or sell
Running a quick liquidity check takes under two minutes and can save you from a costly surprise. Work through these steps in order:
- Check ADTV against your order size. Pull the 20-day or 30-day average daily volume from your broker or a financial data site. Keep your planned order below 1% of ADTV to minimize market impact. For a stock with a relatively high average daily volume, it means sizing your order small relative to that volume to avoid market impact.
- Inspect the bid-ask spread as a percentage of price. Divide the spread by the midpoint price. A very narrow spread is healthy for large caps. A wider spread can be a warning sign, requiring careful consideration.
- Review recent trade prints and order-book depth. Most brokers display Level 2 quotes showing bids and asks at multiple price levels. Confirm there is meaningful size at several levels, not just the top of book.
- Factor in market cap and listing venue. Large-cap stocks and major ETFs typically attract the volume and market makers that sustain tight spreads. Micro-cap, penny, and OTC stocks often lack both, creating execution risk even for small orders.
- Adjust your order size or break it into tranches. If your intended position is large relative to ADTV, split it across multiple sessions. The stock average price calculator at Tickerplace can help you track your average cost when executing in tranches.
How liquidity shapes order types and real trading costs
Choosing between a market order and a limit order is partly a liquidity decision. The table below maps order type to liquidity context.
| Order type | Best liquidity context | Risk in illiquid markets |
|---|---|---|
| Market order | High-liquidity, tight-spread stocks | Fills at unknown price; slippage can be significant |
| Limit order | Any liquidity level | May not fill; partial fills are common in thin markets |
| Limit order with IOC/FOK | Moderate to low liquidity | Controls price but may result in no fill at all |
In a liquid stock, a market order fills almost instantly at or very near the quoted price. In an illiquid one, the same order can walk up the order book, filling at progressively worse prices until your full size is absorbed. That price walk is slippage, and it is entirely invisible in the commission line.
Limit orders solve the slippage problem but introduce fill risk. In a thinly traded stock, a limit order at the midpoint may sit unfilled for hours or days, leaving you exposed to the price moving away before you get in. Time-in-force settings (day, good-till-canceled, immediate-or-cancel) let you control how long the order remains active, but none of them guarantee a fill.
Estimating slippage before you trade is straightforward: look at the order-book depth and calculate how far through the book your order size would reach. If your 2,000-share order would exhaust the first three price levels, the average fill price across those levels is your expected execution price, not the top-of-book quote.
For readers interested in more advanced execution tactics, liquidity sweep strategies offer a framework for timing entries around liquidity concentrations in the order book.
Examples of liquid vs. illiquid U.S. securities
Concrete examples make the spectrum tangible:
- Large-cap S&P 500 stocks (think the top 50 by market capitalization): ADTV is very high for large-cap stocks, and spreads are typically just a few pennies. Market makers compete aggressively for order flow. These are among the most liquid equity instruments available to retail traders.
- Major broad-market ETFs (tracking the S&P 500, Nasdaq-100, or total market): ETFs can be liquid even when some underlying holdings are less liquid, because authorized participants and market makers use the creation/redemption mechanism to arbitrage prices and maintain tight spreads. An ETF tracking a liquid index typically shows spreads of one cent or less during regular hours.
- Mid-cap exchange-listed stocks: ADTV is moderate for mid-cap stocks and spreads tend to be slightly wider. Still manageable for most retail order sizes, but worth checking depth before trading.
- Small-cap and micro-cap stocks: ADTV is lower for small-cap and micro-cap stocks and spreads can be noticeably wider. A modest retail order can move the price noticeably.
- OTC and penny stocks: Often lack dedicated market makers and consistent order flow. Selling at the quoted price can be genuinely difficult. Spreads can be quite large and the bid can become unreliable during volatile sessions for OTC and penny stocks.
When to prioritize liquidity in your investment decisions
Liquidity should be a primary selection criterion in three situations: short-term trading (where you need to enter and exit quickly), large position sizes relative to the stock’s ADTV, and any scenario where you might need to convert the position to cash on short notice.
For long-term, conviction-based investing, accepting lower liquidity can be rational. A small-cap company with strong fundamentals may trade thinly, but if your holding period is measured in years and your position size is modest relative to ADTV, the liquidity premium you earn for tolerating that illiquidity can be a genuine return driver. The key discipline is sizing positions so that exiting, even slowly, remains feasible.
Liquidity also interacts with stock volatility: thinly traded stocks tend to show wider price swings because a single order can move the market. That volatility amplifies both gains and losses, which is why position sizing and diversification matter more, not less, in illiquid names.
Tickerplace’s perspective on liquidity as a risk control
Liquidity is the variable most beginner investors underestimate, and it is the one that tends to hurt them first. Valuation gets most of the attention, and rightly so, but a stock that is priced right and impossible to exit at that price is not actually a good trade. The spread and slippage on entry and exit can quietly consume a meaningful portion of a position’s return, particularly for smaller accounts where transaction costs represent a larger share of capital deployed.
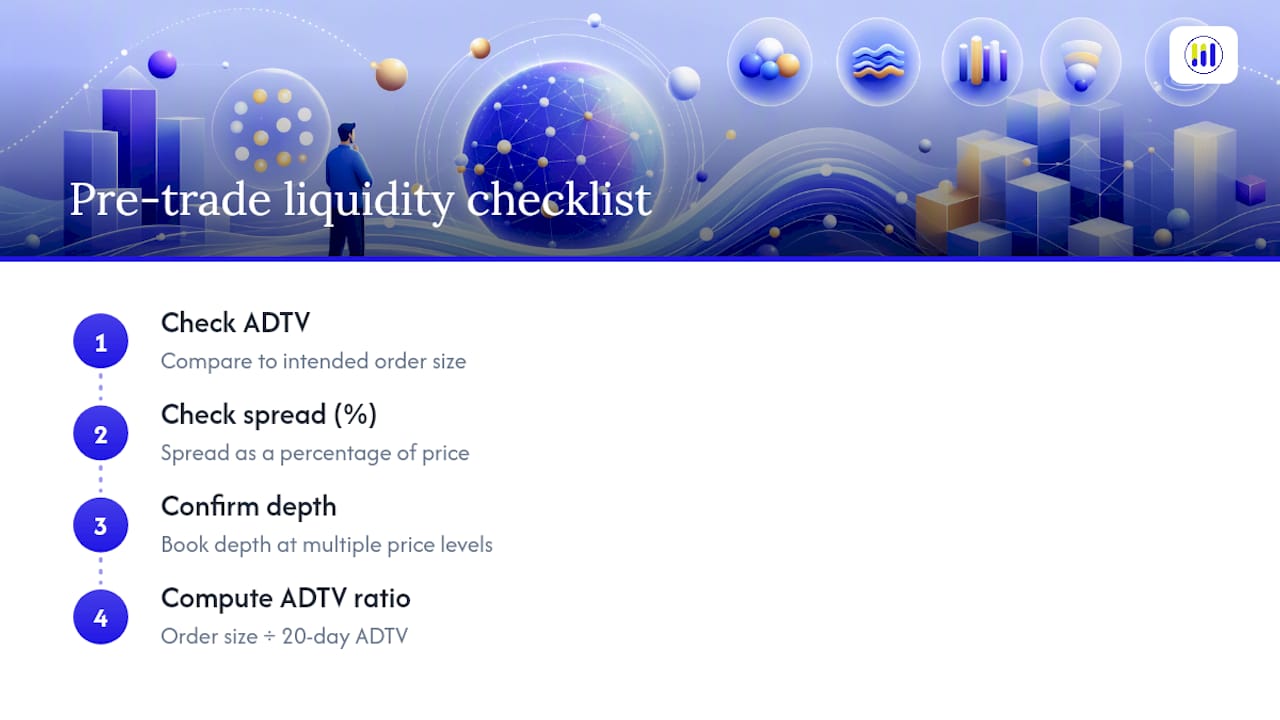
The habit worth building is simple: before placing any order, check ADTV, check the spread as a percentage of price, and confirm there is depth in the book at multiple levels. That three-step check takes less than two minutes and gives you a realistic picture of what the trade will actually cost. Tickerplace’s stock valuation checker pairs naturally with this habit, letting you confirm that a stock is attractively priced before you also confirm it is liquid enough to trade efficiently.
Pro Tip: *For any stock you are considering, divide your intended order size by the 20-day ADTV.

Ready to pair your liquidity checks with institutional-grade valuation? Tickerplace gives you free access to DCF, P/E, and P/S valuation models, a powerful stock screener, and side-by-side comparison tools for 10,000+ U.S. and ASX-listed equities. Use the stock profit/loss calculator to factor spread and slippage into your expected return before you commit to a trade.
Sources
Authoritative references for investors who want to verify definitions or go deeper:
- Investor
- Finra
- What is liquidity and how is it calculated? | Fidelity
- What is market liquidity? | OANDA
- Market liquidity - Wikipedia
This article is general information, not a substitute for advice from a qualified financial advisor. Consult a qualified financial professional about your own circumstances before acting on anything here.
FAQ
What is stock liquidity in simple terms?
Stock liquidity describes how easily you can buy or sell shares at a fair price without significantly moving the market. A highly liquid stock fills your order quickly and at close to the quoted price; an illiquid one may require accepting a worse price or waiting for buyers.
What is a good ADTV for a stock to be considered liquid?
For most retail-sized orders, a stock with very high average daily volume is generally workable.
How does liquidity affect trading costs?
Liquidity affects costs through the bid-ask spread and slippage. In liquid stocks, spreads are often a few pennies; in illiquid ones, spreads can reach several percent of the share price. Slippage adds further cost when a large order exhausts available depth and fills at progressively worse prices.
Are ETFs always more liquid than individual stocks?
Not always, but major broad-market ETFs tend to be highly liquid because market makers and authorized participants use the creation/redemption mechanism to keep spreads tight, even when some underlying holdings trade less actively. Niche or thinly traded ETFs can still carry meaningful liquidity risk.
Why does liquidity matter more during market stress?
Liquidity can evaporate quickly during news events, earnings releases, or broad sell-offs. Bid-ask spreads widen, order-book depth thins, and the price impact of any given order increases. Investors who assume normal-market liquidity will persist during stress often discover the cost of that assumption at the worst possible moment.