
How to Research Equities: A Step-by-Step Investor Guide
The most effective way to research any equity is to work through a single, repeatable sequence: understand the business first, verify the fundamentals, check the valuation against intrinsic value, assess the risks, and then set up monitoring before you commit capital. Professional investors analyze business model → fundamentals → valuation before ever glancing at a price chart — most retail investors invert that order and pay for it. The primary documents for this process live on SEC EDGAR, and tools like Tickerplace can automate the intrinsic-value calculations so you spend your time on judgment, not arithmetic.
Quick 20-minute scan checklist:
- CEO/leadership and core mission (2 min)
- Revenue trend over 3 years (3 min)
- Profitability: is operating income positive and growing? (3 min)
- Debt load: debt-to-equity ratio well above typical industry levels warrants scrutiny (3 min)
- Basic valuation multiple: P/E or P/S vs. sector median (5 min)
- One red flag check: negative operating cash flow, auditor concern, or unexplained related-party transactions (4 min)
| Signal | Quick verdict |
|---|---|
| Consistent revenue growth (3+ years) | Pass — investigate further |
| Positive and stable free cash flow | Pass — strong quality indicator |
| Unexplained rising debt with flat revenue | Fail — requires explanation |
| Recurring non-GAAP adjustments | Caution — read footnotes carefully |
| Valuation multiple far above sector median | Caution — justify the premium |
| Unexplained rising debt with flat revenue | Fail — requires explanation |
| Recurring non-GAAP adjustments | Caution — read footnotes carefully |
| Valuation multiple far above sector median | Caution — justify the premium |
Table of Contents
- What does a step-by-step equity research workflow look like?
- Where do you find reliable data for stock research?
- Fundamental analysis vs. technical analysis: which one should you use?
- How do you build screeners and watchlists that actually work?
- How do you read a 10-K or 10-Q for investment decisions?
- How do valuation models work, and which one should you use?
- How do you turn your research into a testable investment thesis?
- How do you monitor holdings and decide when to exit?
- How Tickerplace fits into this research workflow
- Key Takeaways
- Why the research process matters more than any single stock pick
- Tickerplace gives you institutional-grade valuation tools for free
- Useful sources for equity research
- FAQ
What does a step-by-step equity research workflow look like?
A structured workflow prevents the most common retail mistake: falling in love with a stock before you have read a single filing. The sequence below is ordered by time investment, from a quick scan to a full thesis.
-
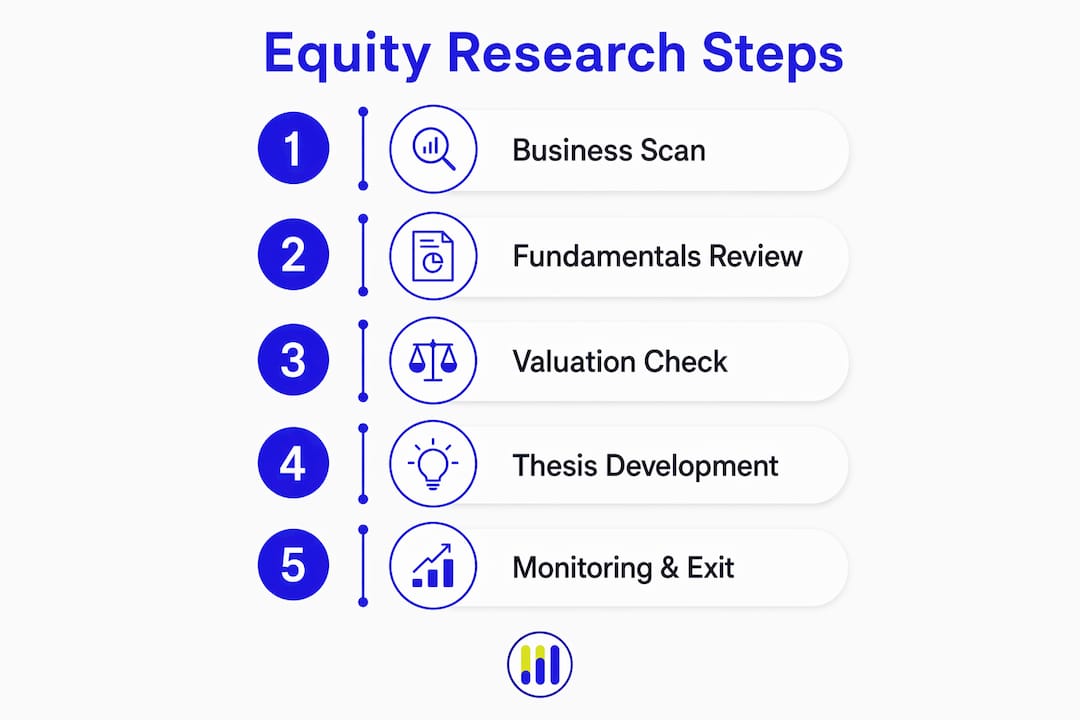
Quick scan (0–20 minutes). Look up the company’s investor relations page or its latest 10-Q on SEC EDGAR. Confirm the business model in one sentence. Check the revenue trend for three years and note whether operating income is positive. If the business fails this test, stop here.
-
Fundamentals review (20–60 minutes). Pull the most recent 10-K. Read the “Business” section, then “Risk Factors,” then the MD&A (Management’s Discussion and Analysis). Calculate or verify: gross margin, operating margin, free cash flow (FCF), and debt-to-equity. Note any year-over-year deterioration.
-
Valuation check (30–60 minutes). Compare the stock’s P/E, P/S, and EV/EBITDA to sector medians. Run a simple intrinsic-value estimate using a DCF or a stock valuation calculator. Set a margin of safety target below your calculated intrinsic value to protect against model error.
-
Qualitative and competitive review (30–60 minutes). Assess management quality, insider ownership, and whether the company has a durable competitive advantage (a moat). Read the latest earnings call transcript for tone and forward guidance.
-
Risk and macro context (15–30 minutes). Identify the top three risks from the 10-K risk factors. Check sector trends and any relevant macroeconomic headwinds (interest rates, commodity prices, regulatory changes).
-
Thesis documentation and monitoring setup (15 minutes). Write a one-paragraph investment thesis. Set price alerts and a calendar reminder for the next earnings date. Record your entry criteria, exit triggers, and the date of your review.
Exit/invalidating signals to watch at every step: a revenue miss combined with a guidance cut, a sudden spike in debt without a clear strategic rationale, a management departure in a key role, or a material legal event disclosed in an 8-K.

Where do you find reliable data for stock research?
The quality of your research is only as good as your sources. Primary documents are always the most reliable starting point; secondary sources add context but can introduce errors or lag.

| Source | Best use case |
|---|---|
| SEC EDGAR (10-K, 10-Q, 8-K, proxy) | Verified facts: financials, risk disclosures, material events |
| Company investor relations page | Earnings transcripts, press releases, supplemental data |
| FINRA Market Data Center | Free ratio data and company comparisons for retail investors |
| Broker research reports | Hypothesis testing and sector context; check the date and conflicts |
| Financial-data platforms (screeners) | Candidate filtering; verify figures against primary filings |
| Aggregated financial news | Macro context and event triggers; not a substitute for filings |
Public companies file 10-Qs and 10-Ks with the SEC; these documents contain the MD&A, audited financial statements, and risk factors that answer the core research questions. The 8-K is equally important for material events between quarterly filings — a surprise CEO departure, a major acquisition, or a regulatory action will appear there first.
Broker research reports are useful for testing your hypothesis against a professional’s model, but always check the publication date and the analyst’s conflict-of-interest disclosures. FINRA’s resources and SEC filings are free and carry no commercial bias, which makes them the natural anchor for any research process.
Fundamental analysis vs. technical analysis: which one should you use?
The short answer: fundamentals tell you what to buy; technicals can help you decide when to buy it. For long-term investors, the business case always comes first.
| Dimension | Fundamental analysis | Technical analysis |
|---|---|---|
| Primary goal | Estimate intrinsic value vs. market price | Identify price trends and timing signals |
| Time horizon | Months to years | Days to weeks (or as a timing overlay) |
| Key inputs | Revenue, margins, FCF, debt, ROE | Price, volume, moving averages, RSI |
| Typical use case | Buy/hold/sell decisions based on value | Entry/exit timing, stop-loss placement |
Key fundamental signals to prioritize: consistent revenue growth, expanding or stable operating margins, positive and growing free cash flow, manageable leverage (debt-to-equity below 1.5× for most industries), and return on equity (ROE) above the cost of equity. Technical indicators such as moving averages, RSI, and support/resistance levels are tools for timing and trend identification, not substitutes for valuation.
Pro Tip: Analyze the business and its fundamentals before you open a price chart. If you look at a chart first, you will unconsciously interpret the fundamentals to match the price action — a well-documented form of confirmation bias.
Consider a practical scenario: a company reports recovering earnings after two difficult years, but the stock has already risen 25% in the prior month on momentum. A chart-first investor might see the price spike and hesitate. A fundamentals-first investor checks the 10-Q, confirms that revenue and margins are genuinely improving, and then uses the chart to find a better entry point rather than to override the thesis.
How do you build screeners and watchlists that actually work?
Screeners are best used as eliminators, not selectors. The goal is to remove companies that fail minimum criteria quickly, so you can spend your research hours on the survivors.
Common filter presets by strategy:
- Value screen: P/E below sector median, P/S below 2×, positive free cash flow, debt-to-equity below 1.5×, market cap above $500M.
- Growth screen: Revenue growth above 15% year-over-year for two consecutive years, expanding gross margins, low or no dividend (reinvesting for growth), market cap $1B–$50B.
- Income screen: Dividend yield above 2.5%, payout ratio below 65%, positive FCF covering the dividend, five-year dividend growth record.
After running a screen, verify the output figures against the company’s actual filings. Screeners pull from aggregated databases that occasionally carry stale or misclassified data.
Watchlist template fields to maintain:
- Ticker and company name
- One-sentence thesis summary
- Key metrics at time of entry (P/E, P/S, FCF yield, debt-to-equity)
- Entry price target and margin of safety
- Exit triggers (e.g., two consecutive quarters of revenue decline)
- Next review date (tied to earnings calendar)
Pro Tip: Set alerts only for events that would change your thesis: earnings releases, guidance updates, and large insider transactions. Price-move alerts for every 1% swing create noise that erodes discipline over time.
Experienced analysts verify revenue growth and margins against sector medians before committing hours to individual-company models. Combining fundamental filters with sector and market-cap constraints narrows a universe of thousands of stocks to a manageable list of 10–20 candidates worth deeper investigation.
How do you read a 10-K or 10-Q for investment decisions?
Most investors skip straight to the earnings per share line. That is a mistake. The sections that matter most are buried deeper in the filing.
Read these sections first, in this order:
- Business (Item 1): Understand the revenue model, key customers, and competitive position.
- Risk Factors (Item 1A): The company’s own list of what could go wrong. Look for new risks added since the prior filing.
- MD&A (Item 7): Management’s explanation of results. Compare their narrative to the actual numbers.
- Financial Statements and Footnotes: The income statement, balance sheet, and cash flow statement, plus the footnotes that explain accounting choices.
- Liquidity and Capital Resources: How much cash does the company have, and how long will it last?
- Recent 8-Ks: Check for material events filed between the quarterly reports.
| Ratio | Formula | Why it matters |
|---|---|---|
| Free cash flow (FCF) | Operating cash flow minus capital expenditures | Shows real cash generation, harder to manipulate than earnings |
| Debt-to-equity | Total debt ÷ shareholders’ equity | Measures financial leverage and solvency risk |
| Return on equity (ROE) | Net income ÷ shareholders’ equity | Indicates how efficiently management uses capital |
| Operating margin | Operating income ÷ revenue | Reveals pricing power and cost control |
| Current ratio | Current assets ÷ current liabilities | Quick check on short-term liquidity |
High-impact red flags to stop a purchase:
- Recurring non-GAAP adjustments that consistently exceed GAAP earnings
- Inconsistent or changing revenue recognition policies (check footnotes)
- Large related-party transactions without clear business rationale
- Negative operating cash flow while capital expenditures are rising
- A qualified or adverse auditor opinion
Read footnotes carefully. Accounting choices around depreciation, goodwill impairment, and lease obligations can materially change how healthy a balance sheet looks. A beginner’s guide to fundamental analysis can help you build fluency with these line items quickly. Always use 3–5 years of data, not a single year’s snapshot, to distinguish a trend from a one-time event. Qualitative factors such as management experience, insider ownership, and competitive advantages are important complements to these financial metrics.
How do valuation models work, and which one should you use?
Valuation is the step where you answer the central question: is the market price justified by the business’s actual worth? No single model is definitive, so using multiple valuation approaches to triangulate intrinsic value is standard practice.
Common valuation metrics by sector:
- P/E (price-to-earnings): Most useful for profitable, mature companies. Compare to the sector median, not the market average.
- PEG (P/E-to-growth): Adjusts P/E for expected earnings growth; a PEG below 1.0 is often considered attractive.
- P/S (price-to-sales): Useful for early-stage or unprofitable companies where earnings are negative.
- EV/EBITDA: Preferred for capital-intensive industries; strips out financing and tax differences.
- Price-to-book: Most relevant for financial companies and asset-heavy businesses.
- Dividend yield: Key for income investors; compare to the 10-year Treasury yield for context.
| Model | Best for | Key sensitivity |
|---|---|---|
| P/E multiples | Profitable, stable businesses | Earnings quality and cycle position |
| P/S multiples | High-growth or pre-profit companies | Revenue growth sustainability |
| DCF (discounted cash flow) | Long-term intrinsic value | Growth rate and discount rate assumptions |
| EV/EBITDA | Capital-intensive or leveraged companies | EBITDA normalization |
A simple intrinsic-value check: Assume a company earns $3.00 per share in FCF, grows at 8% annually for 10 years, and you apply a 10% discount rate. A rough DCF produces an intrinsic value near $37–$42 per share (base case). If the stock trades at $30, you have a margin of safety of roughly 20–28%. Setting a margin of safety of 20–30% below your calculated intrinsic value reduces downside if your inputs prove too optimistic. Treat the DCF as a range across base, conservative, and optimistic scenarios rather than a single point estimate.
Pro Tip: Always compare a stock’s P/E and P/S to its sector median, not the broad market. A low P/E can reflect either a genuine bargain or a structurally declining business — the sector context tells you which story is more likely.
How do you turn your research into a testable investment thesis?
A thesis is not a prediction. It is a structured argument with defined conditions under which you would be wrong. Without that structure, you will hold a losing position far too long.
Thesis template:
- Investment idea: One sentence stating what you believe and why (e.g., “Company X is undervalued because the market is pricing in a permanent margin decline that the last two quarters’ data do not support”).
- Time horizon: 12 months, 24 months, or longer.
- Key drivers: The two or three factors that must materialize for the thesis to work (revenue reacceleration, margin expansion, debt paydown).
- Valuation target: Your intrinsic-value estimate and the price at which you would consider the position fully valued.
- Position sizing: Start with a small starter position (1–2% of portfolio) until the thesis begins to confirm. Add in tranches as key drivers materialize.
- Top 3 risks and exit triggers: Be specific. “Revenue declines more than 10% in two consecutive quarters” is an exit trigger. “Things get worse” is not.
Position sizing rules tied to conviction:
- Low conviction (thesis unproven): 1–2% of portfolio.
- Moderate conviction (one key driver confirmed): 3–4% of portfolio.
- High conviction (multiple drivers confirmed, valuation still attractive): up to 5–6% of portfolio.
- No single position should exceed 8–10% regardless of conviction.
- Sector concentration above 25% of the portfolio warrants a deliberate review.
Invalidating signals to record and monitor: two consecutive quarters of revenue deterioration, a key management departure (CFO or CEO), operating margin compression of more than 300 basis points without a clear temporary explanation, or a competitor breakthrough that threatens the company’s moat.
Before committing significant capital, paper-trade the thesis for one earnings cycle. Track whether the company’s actual results match your model’s assumptions. If the thesis survives one full quarter of real data, your conviction level is better calibrated. For investors who want AI-generated signals as a cross-check, daily alpha signals from automated platforms can surface divergences worth investigating.
How do you monitor holdings and decide when to exit?
Monitoring is where discipline either holds or breaks down. The goal is a schedule that keeps you informed without triggering emotional reactions to short-term noise.
| Cadence | Tasks |
|---|---|
| Daily | Price alerts for moves above a defined threshold; scan for 8-K filings on holdings |
| Weekly | Review sector news and macro data relevant to your positions |
| Monthly | Check insider transaction disclosures; review portfolio concentration |
| Quarterly | Read the 10-Q; compare results to your thesis assumptions; update your watchlist |
Event triggers that warrant immediate re-review:
- Earnings miss combined with a guidance cut
- Material legal event (SEC investigation, major lawsuit) disclosed in an 8-K
- Sudden leverage spike (debt-to-equity rises more than 0.5× in one quarter)
- Dividend suspension or cut
- Auditor change or going-concern note
Portfolio-level risk management: cap individual positions at 8–10%, sector exposure at 25–30%, and run a correlation check quarterly to avoid holding five positions that all move together in a downturn. Rebalance when a position grows beyond its target weight due to price appreciation, not just when it falls.
Keep a dated research log for every holding. Record the original thesis, the key metrics at entry, and the date of each review. Investors who maintain written records make faster, less emotional decisions when conditions change, because they can compare current data to their original assumptions rather than relying on memory.
How Tickerplace fits into this research workflow
Tickerplace is designed to handle the most time-consuming parts of the workflow described above, specifically the valuation calculations and multi-model intrinsic-value checks that would otherwise require a spreadsheet.
Where Tickerplace fits in the workflow:
- Quick intrinsic-value check: Run any US or ASX-listed ticker through the intrinsic value calculator to get a DCF, P/E, and P/S-based estimate in seconds. Compare the output to the current market price to identify a potential margin of safety.
- Multi-model valuation: Tickerplace generates daily fair value targets using DCF, P/E, and P/S models simultaneously, so you can see whether all three approaches agree or diverge. Divergence is itself a signal worth investigating.
- Screener and watchlist setup: Use the built-in screener to apply fundamental filters (profitability, leverage, growth) and narrow a sector to a shortlist of candidates before committing research hours.
- Side-by-side comparison: Compare two or more stocks on the same valuation metrics to identify which offers the better risk-adjusted entry point.
- Sector and industry analysis: Review sector-level valuation trends to contextualize whether a stock’s multiple is high or low relative to its peers.
How to integrate Tickerplace output into your thesis:
- Run the stock valuation checker on your candidate ticker.
- Note the intrinsic-value estimate and compare it to the current market price.
- Record the margin of safety (or premium) in your research log.
- Cross-check the key inputs (revenue, earnings, growth rate) against the company’s actual SEC filings.
- Use the output as a starting point for your DCF scenario analysis, not as a final answer.
A critical caution: always verify key inputs against SEC EDGAR filings and the company’s own financial statements. Automated outputs are a guide and a time-saver; they are not a substitute for reading the 10-K. No model is more reliable than the quality of the data it uses.
Key Takeaways
Effective equity research follows a single repeatable sequence: understand the business, verify the fundamentals, check the valuation against intrinsic value, assess the risks, and monitor with objective triggers.
| Point | Details |
|---|---|
| Start with the business | Read the “Business” and “Risk Factors” sections of the 10-K before looking at any price chart. |
| Use primary sources | SEC EDGAR filings are the most reliable data source; always verify screener figures against actual filings. |
| Compare multiples in context | A low P/E or P/S only means something when compared to sector medians, not the broad market average. |
| Set a margin of safety | Target a 20–30% discount to your calculated intrinsic value to protect against model error. |
| Tickerplace automates valuation | Use Tickerplace’s free DCF, P/E, and P/S calculators to run daily intrinsic-value checks across 10,000+ equities. |
Why the research process matters more than any single stock pick
Most investors spend the majority of their time searching for the next great stock and very little time building a repeatable process. That is the wrong ratio. A disciplined research workflow, applied consistently, produces better long-term outcomes than any single brilliant pick, because it compounds your judgment over time rather than your luck.
The workflow in this guide is not theoretical. It reflects how professional analysts actually sequence their work: business model first, then numbers, then price. The reason that order matters is psychological as much as analytical. When you understand the business before you see the price, you form an independent view of what the company is worth. When you see the price first, you anchor to it and rationalize everything else around it.
Tickerplace was built on that same principle. The platform’s multi-model valuation approach, covering DCF, P/E, and P/S simultaneously, is designed to give individual investors an independent intrinsic-value reference before they check the market price. The daily updates across 10,000+ equities mean the data is current, but the responsibility for verifying key inputs against SEC filings always stays with the investor. Treat automated outputs as a well-informed starting point, not a verdict.
Tickerplace gives you institutional-grade valuation tools for free
Individual investors who follow the workflow above still face one practical bottleneck: building and updating valuation models for every candidate takes hours. Tickerplace removes that bottleneck.

The platform’s free tools cover the full valuation workflow: run a multi-model intrinsic-value check using DCF, P/E, and P/S analysis; screen thousands of US and ASX-listed equities by fundamental criteria; compare stocks side by side; and calculate your margin of safety in seconds. The stock valuation calculator updates daily, so the numbers reflect current market data rather than a static spreadsheet you built six months ago.
A practical first step: pick one ticker you are currently researching and run it through the intrinsic value calculator. Compare the output to the current price, note the implied margin of safety, and then cross-check the key revenue and earnings inputs against the company’s latest 10-Q on SEC EDGAR. That single exercise will calibrate how the tool fits into your process. Always verify material figures in primary filings before making any investment decision.
Useful sources for equity research
| Source | What to use it for |
|---|---|
| SEC EDGAR company search | Pull 10-K, 10-Q, 8-K, and proxy filings directly from the source |
| How to read a 10-K (SEC) | Official guide to navigating annual report sections |
| FINRA — Evaluating Stocks | Free ratio data, investor education, and company comparison tools |
| FINRA BrokerCheck | Verify broker and advisor registration and disciplinary history |
| Tickerplace Intrinsic Value Calculator | Run multi-model intrinsic-value estimates on 10,000+ equities |
| Tickerplace Stock Valuation Checker | Quick overvalued/undervalued check for any US or ASX ticker |
Keep a research folder for each position: save the 10-K and 10-Q PDFs, the earnings call transcript, any analyst notes you reference, and your own dated thesis document. When you revisit a position three months later, that folder tells you exactly what you knew and when you knew it, which is the only honest basis for evaluating whether your process is improving.
Recommended next action: run a valuation check on one ticker you are actively researching using Tickerplace’s free tools, then open the company’s most recent 10-Q on SEC EDGAR and verify the revenue and FCF figures the model uses.
This article is general information for educational purposes only and does not constitute investment advice. Always verify current figures with primary sources and consult a qualified financial professional for decisions specific to your situation.
FAQ
What is the best way to research stocks?
Start with the company’s 10-K on SEC EDGAR to understand the business model, risks, and financial trends, then validate the valuation using multiples compared to sector medians and a margin-of-safety calculation.
How do you do equity research step by step?
Work through six steps in order: quick business scan, fundamentals review (revenue, margins, FCF, debt), valuation check (P/E, P/S, DCF), qualitative review (management, moat), risk and macro assessment, and thesis documentation with monitoring rules.
What is the 7% rule in stocks?
The 7% rule is a sell discipline used by some investors: exit a position if it falls 7–8% below your purchase price to limit losses before they compound. It is a risk-management heuristic, not a valuation method, and works best when paired with a clearly defined entry thesis.
How do you turn stock research into an investment decision?
Write a one-paragraph thesis that states your valuation target, the two or three drivers that must materialize, and the specific conditions that would invalidate the thesis; only commit capital when the stock trades at a meaningful discount to your intrinsic-value estimate.
Can free tools replace paid research platforms for individual investors?
SEC EDGAR filings, FINRA’s investor resources, and free platforms like Tickerplace cover the core research workflow, including multi-model valuation and fundamental screening, without a subscription fee for most use cases.