
Step by Step Equity Research: A Guide for Aspiring Analysts

TL;DR:
- Equity research involves analyzing a company’s fundamentals to decide whether to buy, hold, or sell its stock. Following a structured workflow ensures reproducibility, with key steps including company screening, financial analysis, valuation, and reporting. Using multiple valuation methods and verification tools like Tickerplace improves accuracy and efficiency for retail investors.
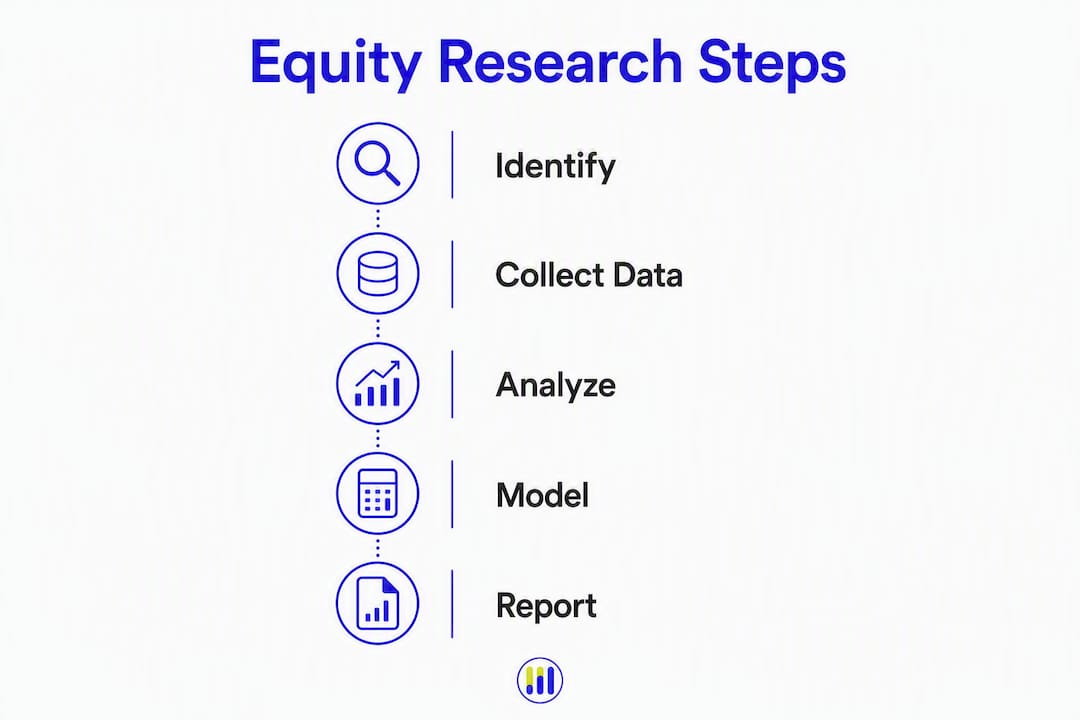
Equity research is the structured process of analyzing a publicly traded company to determine whether its stock is worth buying, holding, or selling. The complete workflow runs in this order: company selection → data gathering → business and industry analysis → financial-statement analysis → forecasting and model building → valuation → investment thesis and write-up → monitoring and revision. A focused retail analyst can complete a quick triage in a few hours and a full write-up with a working model in several days, varying by complexity.
Start here before you open a spreadsheet:
- Pick one stock from a sector you already understand and add it to a watchlist.
- Open SEC EDGAR and download the company’s most recent 10-K and the last two 10-Q filings.
- Create a model file with three tabs: Income Statement, Balance Sheet, and Cash Flow Statement.
- Write a one-paragraph preliminary thesis stating why this company is worth researching.
- Set a deadline: triage by end of day one, full model and write-up by end of day three.
That five-step action plan is the skeleton. Everything below adds the muscle.
What is equity research, and what does it actually produce?
Equity research is the disciplined analysis of a company’s financial performance, competitive position, and valuation to support an investment decision. The output is always a recommendation: buy, hold, or sell, with a price target and the reasoning behind it. For a deeper look at how the discipline is structured, Tickerplace’s equity research guide covers the role and report types in full.

Buy-side vs. sell-side: what each role produces
The two dominant contexts for equity research differ in audience and incentive structure.
| Dimension | Buy-side research | Sell-side research |
|---|---|---|
| Who produces it | Portfolio managers, analysts at funds | Analysts at investment banks and brokerages |
| Primary audience | Internal investment committee | External clients, institutional investors |
| Output format | Internal memo, model, brief thesis | Published report with formal rating and price target |
| Incentive | Generate alpha for the fund | Generate trading commissions, support banking relationships |
| Typical length | 1–5 pages, internal | 10–40 pages, distributed externally |
Sell-side reports follow a formal structure: cover page with rating and price target, investment summary, detailed financial model, valuation, and risks. Buy-side notes are shorter and more direct because the audience already knows the sector. Both types share the same analytical core: understand the business, verify the numbers, and value the company.
Report formats also vary by purpose. An initiation of coverage is a full deep-dive published when an analyst begins covering a stock. An update note follows an earnings release or material event. A quick note flags a single catalyst. A deep-dive revisits the thesis after a major strategic shift. Knowing which format you are writing shapes how much depth each section needs.
A consistent workflow matters because it makes your analysis reproducible and auditable. When your assumptions change, you know exactly which cell to update and which section of the report to revise.
How to conduct equity research step by step
Practical equity research follows a clear stage sequence: understand the business, verify the numbers, then value conservatively. The eleven steps below map directly to that logic, with a deliverable and a suggested timebox for each.
-
Define your investment objective and universe (30 minutes) Decide what you are looking for: growth, value, income, or a special situation. Set minimum criteria for market cap, liquidity, and sector. Deliverable: a written one-paragraph investment mandate.
-
Screen and build a shortlist (1 hour) Use a screener to filter by your criteria. Narrow to five to ten candidates. Deliverable: a ranked shortlist with ticker, sector, market cap, and one-line rationale for each.
-
Initial company triage (1–2 hours) Read the most recent 10-K executive summary, the business description, and the risk factors section. Look for immediate disqualifiers: going-concern language, active SEC investigation, or revenue concentration above 50% in a single customer. Deliverable: a pass/fail decision with three bullet reasons.
Pro Tip: Set three hard triage red flags before you start reading. If any one of them appears, stop the process and move to the next candidate. Common disqualifiers include auditor changes in consecutive years, negative operating cash flow while net income is positive, and a debt-to-equity ratio above 3x in a capital-light business.
-
Collect primary documents (1 hour) Download the 10-K, last two 10-Qs, the most recent proxy statement (DEF 14A), and the last four earnings call transcripts from SEC EDGAR or the investor relations page. Deliverable: a sourced document folder with file names and dates.
-
Business and industry analysis (2–3 hours) Map the company’s revenue model, customer segments, and pricing power. Identify the top two or three competitors and the industry’s structural dynamics using Porter’s Five Forces as a framework. Assess management quality through the proxy (compensation structure, insider ownership) and through transcript language. Deliverable: a one-page business summary covering moat, management, and market size.
-
Financial-statement analysis (2–3 hours) Build a three-year historical model from the income statement, balance sheet, and cash flow statement. Calculate key ratios: gross margin, operating margin, return on equity, debt-to-equity, and free cash flow yield. Pay close attention to shareholders’ equity components — outstanding shares, retained earnings, and treasury stock — because they reveal dilution patterns and capital-return policies that income-statement analysis alone will miss. Deliverable: a populated three-year historical model with ratio summary.
-
Forecast and build a simple model (2–3 hours) Project three to five years of revenue, operating income, and free cash flow. Use the company’s own guidance as a starting point, then stress-test it against industry growth rates and historical margins. Keep the model simple: one base case, one bull case, one bear case. Deliverable: a three-scenario Excel model with explicit assumptions documented in a separate tab.
-
Valuation cross-checks (1–2 hours) Run at least two valuation methods: a DCF for intrinsic value and a comparable-company multiples analysis for relative value. If the two methods produce a wide spread, investigate why before drawing a conclusion. Deliverable: a valuation summary table with intrinsic value range and implied upside or downside.
-
Investment thesis and risk assessment (1 hour) Write a three-to-five bullet thesis stating the specific catalysts that will close the gap between price and value. Then list the top three risks that would invalidate the thesis, with a probability and impact rating for each. Deliverable: a one-page thesis and risk matrix.
-
Write-up and pre-trade checklist (1–2 hours) Draft the report using the template in the next section. Run the checklist before finalizing a recommendation. Deliverable: a complete report draft with all attachments.
-
Monitoring plan (30 minutes to set up) Define the triggers that will prompt a model revision: earnings releases, guidance changes, competitor announcements, and macro shifts. Set calendar reminders for the next two earnings dates. Deliverable: a one-page monitoring schedule with revision triggers.
Pro Tip: When resources are limited, prioritize the cash flow statement over the income statement. Net income can be managed through accounting choices; free cash flow is harder to fake. If a company reports rising profits but declining operating cash flow for two consecutive years, treat it as a material red flag before building a full model.

How do you build a DCF model and run a sensitivity analysis?
The purpose of a DCF is to translate your forecast assumptions into a single intrinsic value per share, then test how sensitive that value is to the inputs that matter most. NYU Stern’s DCF materials identify four key drivers: forecasted cash flows, the high-growth horizon, terminal value assumptions, and the discount rate. Getting those four right matters more than model complexity.
Choosing FCFF vs. FCFE
Free cash flow to the firm (FCFF) is the right starting point for most companies because it is capital-structure neutral. Use free cash flow to equity (FCFE) when the company has a stable, predictable debt schedule and you want to model equity value directly. For a first model, FCFF discounted at the weighted average cost of capital (WACC) is the standard approach.
Example DCF inputs and output
The table below shows a simplified set of inputs for a hypothetical mid-cap technology company. These are illustrative assumptions, not a real company’s figures.
| Input | Base case | Bull case | Bear case |
|---|---|---|---|
| Revenue growth (Year 1–3) | 12% | — | 6% |
| Capex as % of revenue | 5% | 4% | 7% |
| Working capital change | 2% of revenue | — | 3% |
| Discount rate (WACC) | 9% | 8% | 11% |
| Terminal growth rate | 3% | — | 2% |
| Implied intrinsic value/share | $48 | $67 | $31 |
The spread from $31 to $67 is the valuation range. If the stock trades at $42, the base case offers modest upside; the bear case implies downside. That spread is the input to your sensitivity table.
Two-way sensitivity table
A two-way sensitivity table holds all inputs constant except two and shows how the intrinsic value per share changes across their ranges. The most useful pairing is discount rate vs. terminal growth rate.
| WACC \ Terminal growth | — | — | — | — | — |
|---|---|---|---|---|---|
| 8% | $31 | $60 | $67 | $67 | — |
| 9% | $42 | — | $48 | $52 | — |
| 11% | — | — | $31 | — | — |
The shaded zone around your base-case assumptions tells you whether the stock is cheap across a wide range of scenarios or only cheap under optimistic assumptions. If the stock is below intrinsic value in fewer than half the cells, the margin of safety is thin.
Where to source each input
- Revenue growth: management guidance in the 10-K or earnings call; cross-check against industry reports.
- Operating margins: historical trend from the income statement; compare to sector peers.
- Capex: property, plant, and equipment schedule in the 10-K footnotes.
- WACC: cost of equity via CAPM (risk-free rate + beta × equity risk premium); cost of debt from the interest expense line and total debt.
- Terminal growth rate: long-run GDP growth is a common anchor; rarely exceed 3–4% for a mature business.
The CFA Institute is direct on this point: valuation is not purely mathematical, and the analyst must apply judgment in model selection and input derivation rather than treating model outputs as definitive answers. Tickerplace’s intrinsic value calculator lets you enter these assumptions directly and produces an intrinsic value estimate you can use as a sanity check against your own model.
What should an equity research report include?
A well-structured report communicates your thesis clearly to any reader, whether that is an investment committee, a client, or your future self reviewing the note six months later. The template below covers every section a professional report needs.
Report template
- Cover / headline: Company name, ticker, exchange, date, analyst name, rating (Buy/Hold/Sell), and price target.
- Investment summary: One paragraph (five to eight sentences) stating the thesis, the key catalyst, the valuation, and the primary risk. This is the section most readers will read in full.
- Investment thesis: Three to five bullet points, each stating a specific, testable reason to own or avoid the stock.
- Key drivers and catalysts: What specific events or metrics will move the stock toward your price target, and over what time horizon.
- Valuation and price target: State the method used (DCF, EV/EBITDA, P/E), the key assumptions, the resulting intrinsic value range, and the single price target with a 12-month horizon.
- Risks and red flags: At least three risks that would invalidate the thesis, each with a brief mitigation note.
- Recommendation and position sizing: Buy/Hold/Sell with a suggested position size as a percentage of portfolio.
- Appendices: Excel model, list of primary filings cited (with dates), earnings call transcript highlights, and a data sources list.
One-page summary layout
The one-page summary sits at the front of the report and contains: the rating and price target in large type, the current price and implied upside, the investment summary paragraph, the three-to-five thesis bullets, the valuation range in a small table, and the top two risks. Everything else goes in the appendices.
Pro Tip: Date-stamp every assumption in your model and in the report. Write “as of [date]” next to every price target, growth rate, and discount rate. When you revisit the note after an earnings release, you will know exactly what the original assumptions were and whether the thesis has changed or just the price.
Checklist of required attachments before distributing a report:
- Excel model with three scenarios and a sensitivity table
- Primary SEC filings cited (10-K, 10-Q, proxy), with filing dates
- Earnings call transcript excerpts supporting management quality assessment
- Industry report or data source for market-size assumptions
- Disclosure statement: who prepared the note, the date, key assumptions, and any conflicts of interest
Which valuation method should you use, and when?
Equity valuation relies on three major model categories: present-value models, multiples-based comparables, and asset-based valuations. The right choice depends on the company’s characteristics and the data available, not on personal preference.
A brief overview of each method before the comparison table:
Discounted cash flow (DCF): Converts projected future cash flows into a present value using a discount rate. Best for companies with predictable, positive free cash flow. Highly sensitive to terminal value and discount rate assumptions.
Comparable company analysis (comps): Values a company relative to peers using multiples such as EV/EBITDA, P/E, or P/S. Fast and market-anchored, but only as good as the peer group selected. A common pitfall is using EV/EBITDA across companies with different depreciation policies or capital structures without adjusting for those differences.
Precedent transactions: Uses acquisition multiples from comparable deals to estimate what a buyer would pay. Useful for M&A analysis but can overstate value in a hot deal market.
Asset-based valuation: Values the company by its net assets (book value or liquidation value). Most relevant for financial companies, holding companies, or distressed situations where going-concern value is uncertain.
For a solid grounding in ratio analysis and how these methods connect to financial statements, the fundamental analysis primer at Tickerplace covers the core techniques in accessible terms.
| Method | Best for | Data needed | Key pros / cons |
|---|---|---|---|
| DCF | Stable, cash-generative businesses | Forecast cash flows, WACC, terminal growth | Intrinsic; highly sensitive to assumptions |
| Comparable company (comps) | Covered sectors with clear peer groups | Peer multiples, EBITDA, revenue, net income | Fast, market-anchored; peer selection is subjective |
| Precedent transactions | M&A valuation, control premium estimates | Deal multiples from comparable acquisitions | Reflects real prices paid; can embed deal-market froth |
| Asset-based | Financial firms, holding companies, distressed | Book value, liquidation estimates | Grounded in balance sheet; ignores earnings power |
No single method is sufficient on its own. Running two or three and comparing the results is standard practice; a wide spread between methods signals that your assumptions or peer selection need review. For high-growth companies where near-term cash flows are negative, a P/S multiple or a revenue-based DCF is often more informative than an EV/EBITDA multiple. The financial metrics guide for tech startups at Price & Accountants covers sector-specific adjustments worth reviewing when you are valuing early-stage or high-growth businesses.
Pre-trade checklist: what to verify before acting on a recommendation
Most analytical errors do not happen in the model. They happen in the gap between finishing the model and executing the trade, when confirmation bias is highest and scrutiny is lowest. This checklist closes that gap.
Model and data integrity:
- All three financial statements reconcile (net income flows to retained earnings; cash from operations ties to the cash flow statement).
- Every source cited in the report has a file name, date, and URL or filing reference.
- Sensitivity analysis is complete and the stock is cheap in the base case, not only in the bull case.
- No input is older than the most recent quarterly filing.
Red-flag scan:
- No going-concern language in the most recent auditor’s report.
- Operating cash flow and net income are moving in the same direction over the last three years.
- No undisclosed related-party transactions flagged in the proxy.
- No material accounting restatements in the last five years.
- Insider ownership is stable or increasing; a sudden drop by management is a warning sign.
Recommendation and position sizing:
- The recommendation is consistent with the valuation range, not just the base case.
- Position size is calibrated to the gap between entry price and your defined stop-loss level.
Pro Tip: Practitioners commonly cap any single position at no more than 10% of a portfolio to control single-name exposure. Calculate your position size from the entry-to-stop distance before you decide how many shares to buy, not after. A wide valuation range should translate directly into a smaller initial position.
Compliance and disclosure:
- The report includes a disclosure statement covering preparation date, key assumptions, and any conflicts of interest.
- If the report will be shared externally, confirm it meets applicable regulatory requirements.
How do you read analyst ratings, price targets, and disclosures?
Analyst ratings are not binary signals. They sit on a scale, and their meaning depends on the firm’s rating system, the analyst’s track record, and the disclosures attached to the report.
Common rating scales and what they imply
Most sell-side firms use a three-tier or five-tier scale. A three-tier scale uses Buy, Hold, and Sell. A five-tier scale adds Outperform and Underperform between Buy and Sell. In practice, “Outperform” typically means the analyst expects the stock to beat its sector benchmark by a defined margin over 12 months, while “Neutral” or “Hold” means roughly in-line performance. “Underperform” or “Sell” ratings are rare on sell-side desks because of the relationship dynamics between banks and the companies they cover.
A “Buy” rating from a sell-side analyst typically implies expected total return of 15% or more over a 12-month horizon, relative to the analyst’s price target. A “Hold” implies expected return within roughly 0–15%. A “Sell” implies the analyst expects the stock to decline or significantly underperform. Always check the firm’s specific rating definitions in the disclosure section of the report, because thresholds vary by firm.
How price targets are constructed
A price target is the analyst’s estimate of fair value 12 months forward, derived from the primary valuation model (usually DCF or a target multiple applied to forward earnings). Two analysts covering the same stock can reach different price targets because they use different discount rates, different peer groups, or different assumptions about the terminal growth rate. When price targets diverge widely, the disagreement is usually in the terminal value or the margin trajectory, not the near-term revenue forecast.
Reading disclosures
Every published research report must include a disclosure section. Check it for three things: whether the firm has an investment banking relationship with the company (which creates a conflict of interest), whether the analyst personally owns shares, and whether the firm makes a market in the stock. A report with multiple active conflicts is not necessarily wrong, but its assumptions deserve extra scrutiny. The SEC EDGAR filing system is the primary source for verifying the company-side disclosures that underpin any analyst’s model.
Where do you get reliable data for equity research?
Research platforms and screeners provide quick access to company financials, analyst consensus data, and news, but primary filings always take precedence for model inputs. The fastest reliable workflow starts with filings and uses platforms to fill gaps.
Primary sources (always check these first):
Tools and platforms:
- Wall Street Prep: — Offers structured financial modeling courses and templates that teach the mechanics of building models from scratch, widely used by analysts entering the profession.
- CFA Institute: — The authoritative source for valuation methodology and professional standards. The CFA curriculum’s equity section covers every method discussed in this guide.
- Tickerplace: Provides daily intrinsic value estimates, multi-model valuation outputs (DCF, P/E, P/S), and a stock valuation checker for quick cross-checks during screening and monitoring. Useful for sanity-checking your own model outputs and for tracking valuation changes over time without rebuilding a model from scratch.
Under time pressure, prioritize in this order: SEC filings → company guidance → consensus estimates → news. Document every source with the date accessed so your model is auditable when you revise it.
Key Takeaways
Equity research produces a defensible buy, hold, or sell recommendation only when the analyst follows a consistent workflow from company selection through to a written thesis, a cross-checked valuation, and a pre-trade checklist.
| Point | Details |
|---|---|
| Follow the eleven-step sequence | Move from triage to model to write-up in order; skipping steps creates gaps that show up in the final recommendation. |
| Use at least two valuation methods | DCF and comparable-company multiples together produce a more reliable intrinsic value range than either method alone. |
| Run a sensitivity table every time | A two-way sensitivity table on WACC and terminal growth rate reveals whether the stock is cheap across scenarios or only under optimistic assumptions. |
| Apply the pre-trade checklist | Verify model reconciliation, source citations, red-flag scan, and position sizing before acting on any recommendation. |
| Tickerplace for daily valuation checks | The Tickerplace intrinsic value calculator and stock valuation checker let you cross-check model outputs and monitor fair value estimates across thousands of US-listed equities. |
What most beginners get wrong about equity research
The most common beginner mistake is treating the DCF output as a precise answer rather than a range of plausible outcomes. A model that produces “$48.23 per share” to two decimal places is not more accurate than one that produces “$45–$52.” The precision is false; the range is honest. The CFA Institute’s guidance is unambiguous on this: valuation requires judgment, and the analyst’s job is to choose appropriate models and derive inputs with context, not to trust the output blindly.
A second persistent error is ignoring the cash flow statement in favor of the income statement. Net income is an accounting construct; free cash flow is what actually funds dividends, buybacks, and debt repayment. A company can report rising earnings for years while quietly consuming cash through working capital expansion or aggressive capitalization of expenses. The cash flow statement exposes that divergence.
Sloppy source tracking is the third failure mode. When you revise a model six months after writing it, you need to know exactly where each assumption came from. A model with undocumented inputs is a model you cannot trust on revision. Date-stamp every assumption, note the filing it came from, and keep a sources tab in every Excel file.
On time management: the most productive analysts spend roughly 60% of their research time on business and industry analysis and only 40% on the model itself. A technically perfect model built on a misunderstood business produces a confident wrong answer. Understand what the company actually does, how it earns its margins, and why customers pay before you build a single formula.
Tickerplace makes the valuation workflow faster
Individual investors doing serious equity research face a real resource gap: institutional analysts have Bloomberg terminals, proprietary databases, and research teams. Tickerplace closes that gap by providing institutional-grade valuation outputs at no cost for core features.

The platform’s multi-model approach runs DCF, P/E, and P/S valuations simultaneously, producing a daily intrinsic value estimate and a fair value target for thousands of US-listed equities. That means you can cross-check your own DCF output against an independent model in seconds rather than rebuilding a parallel spreadsheet. The stock valuation calculator lets you enter your own assumptions and see how they compare to the platform’s estimates, which is particularly useful when your WACC or terminal growth rate differs from consensus.
For the monitoring step, the stock intrinsic value checker gives you a ticker-based fair value lookup updated daily, so you can track whether the margin of safety on a position you already own is widening or narrowing without rebuilding the model each time. Free access covers the core valuation tools; Tickerplace Pro unlocks full DCF breakdowns, scenario analysis, historical financials, and advanced screeners for analysts who need deeper inputs.
Start with the intrinsic value calculator on the first stock from your watchlist and use the output as your DCF sanity check before finalizing your price target.
Useful sources and further reading
The sources below underpin the analysis in this guide. Check filings first when updating a model, then company guidance, then consensus estimates.
- Valuation: Principles and Practice — DCF Valuation (NYU Stern / Aswath Damodaran): The foundational academic reference for DCF inputs, terminal value methods, and discount rate selection. Use this when setting up your model structure.
- Equity Valuation: Concepts and Basic Tools | CFA Institute: The authoritative professional standard for valuation model selection and input judgment. Required reading for anyone pursuing the CFA designation.
- How to Research Stocks | Fidelity Investments: Practical overview of research workflows, screeners, and data sources for retail investors.
- Equity Research: How to Analyze Stocks Step-by-Step | Zerodha Varsity: A stage-based workflow for limited-resource analysts covering business understanding, checklist application, and conservative valuation.
- Key Components of Shareholders’ Equity | Investopedia: Clear explanation of balance-sheet equity components; useful for the financial-statement analysis step.
- Equity Research Checklist: 12 Steps | Calypso Copilot: Practitioner checklist covering position sizing, stop-loss logic, and pre-trade verification steps.
- How to Do Equity Research: Your Best Actionable Guide | FinanceWalk: Eleven-step actionable sequence corroborating the workflow in this guide.
- Financial Statements Glossary | Price & Accountants: Practical reference for interpreting balance-sheet and income-statement line items.
- Tickerplace — Stock Market, Research & Analysis Tool: Multi-model valuation platform with daily intrinsic value estimates, calculators, and financials coverage for 10,000+ US and ASX-listed equities.
- Wall Street Prep: Structured financial modeling courses and certification programs used widely by analysts entering the profession.
FAQ
How do you write an equity research report step by step?
Start with a cover page (rating, price target, date), then write a one-paragraph investment summary, followed by thesis bullets, key drivers, valuation with assumptions, risks, and a recommendation with position sizing guidance. Attach your Excel model, primary SEC filings cited, and a disclosure statement.
What is the checklist for equity research?
The core checklist covers model reconciliation (all three statements tie), source citations verified with dates, sensitivity analysis completed, red flags cleared (no going-concern language, no divergence between net income and operating cash flow), position size calculated from the entry-to-stop gap, and a disclosure statement included.
What are the main components of shareholders’ equity?
Shareholders’ equity comprises outstanding shares, additional paid-in capital, retained earnings, and treasury stock. These components reveal dilution patterns and capital-return policies that income-statement analysis alone does not capture.
How long does a full equity research report take to complete?
A focused analyst can complete a triage in two to three hours and a full report with a working model in ten to fifteen hours, depending on the complexity of the business and the availability of primary data.
Can you do equity research without a Bloomberg terminal?
Yes. SEC EDGAR provides all primary filings at no cost, and platforms like Tickerplace offer multi-model valuation outputs, daily intrinsic value estimates, and financial data for thousands of US-listed equities without a subscription fee for core features.