
What Is Earnings Per Share? EPS Explained for Investors

TL;DR:
- Earnings per share indicates a company’s profitability on a per-share basis, with higher EPS supporting higher stock valuations.
- Investors should focus on diluted EPS for a more accurate and conservative measure, especially for companies with complex capital structures.
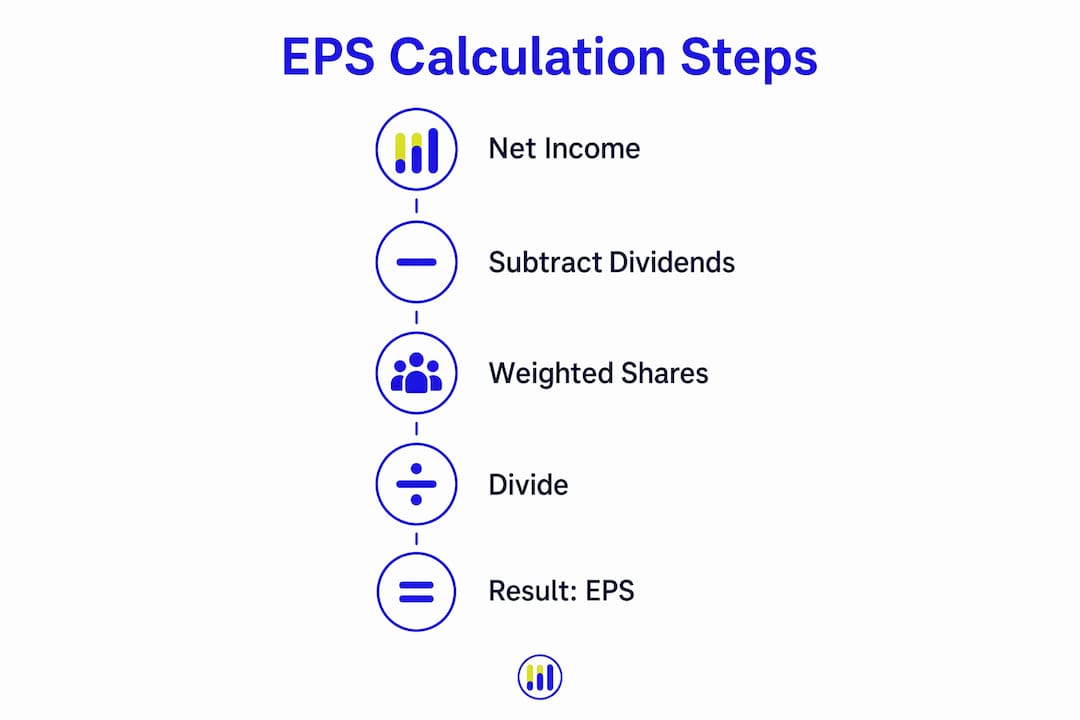
Earnings per share (EPS) is the portion of a company’s net income allocated to each outstanding share of common stock. Under U.S. GAAP, the formula is straightforward:
EPS = (Net income − Preferred dividends) ÷ Weighted average common shares outstanding
- A higher EPS signals greater profitability per share and generally supports a higher stock price.
- A lower EPS suggests weaker earnings power, though context always matters.
- EPS feeds directly into the price-to-earnings (P/E) ratio, the most widely used valuation shortcut in equity analysis.
Table of Contents
- What is earnings per share, and how does it differ from dividends?
- How to calculate basic EPS step by step
- Basic EPS vs. diluted EPS: what changes and why it matters
- Where to find EPS in company reports and filings
- How investors use EPS: valuation, comparisons, and trend analysis
- What moves EPS: buybacks, share issuance, and accounting choices
- Limits and common pitfalls when using EPS
- Worked numeric examples: computing basic and diluted EPS
- Tickerplace tools that help you compute and apply EPS
- Key Takeaways
- EPS in practice: a Tickerplace perspective
- Free EPS and valuation tools on Tickerplace
- Useful sources and further reading
- FAQ
What is earnings per share, and how does it differ from dividends?
EPS measures the earnings attributable to common shareholders on a per-share basis. Under U.S. GAAP, preferred dividends are subtracted from net income before dividing by shares outstanding because preferred shareholders have a prior claim on earnings. What remains belongs to common shareholders, and dividing that figure by the share count tells you how much profit each share theoretically “earned” during the period.
A common misconception is that EPS equals the cash a shareholder receives. It does not. EPS represents profit per share; dividends are actual cash distributions the board chooses to pay. A company can report strong EPS and pay zero dividends, reinvesting all earnings into growth instead. The two figures move independently.
How to calculate basic EPS step by step
Basic EPS uses the weighted average number of common shares outstanding, not the end-of-period count, because share counts change throughout the year through buybacks, new issuances, or stock splits. The weighted average reflects how long each tranche of shares was actually outstanding.
The basic EPS formula:
Basic EPS = (Net income − Preferred dividends) ÷ Weighted average common shares outstanding
Step-by-step worked example:
Assume a company reports:
- Net income: $10,000,000
- Preferred dividends: $500,000
- Shares outstanding January 1: 4,000,000
- New shares issued April 1 (9 months remaining): 600,000
- Calculate earnings available to common shareholders: $10,000,000 − $500,000 = $9,500,000
- Compute the weighted average shares:
- 4,000,000 × (12/12) = 4,000,000
- 600,000 × (9/12) = 450,000
- Weighted average = 4,450,000 shares
- Divide: $9,500,000 ÷ 4,450,000 = $2.13 basic EPS
Analysts prefer the weighted average over end-of-period shares precisely because mid-year changes would otherwise distort the figure.
Pro Tip: The weighted average share count and any adjustments for stock splits or stock dividends are disclosed in the footnotes to the financial statements, not always on the face of the income statement. Always check the notes before accepting the denominator at face value.

Basic EPS vs. diluted EPS: what changes and why it matters
Companies with complex capital structures, including those that have issued stock options, warrants, or convertible debt, must report both basic and diluted EPS. Diluted EPS accounts for the additional shares that would exist if every potentially dilutive instrument were exercised or converted.
The most common method for modeling options and warrants is the treasury stock method: it assumes the proceeds from hypothetical option exercises are used to repurchase shares at the average market price during the period. Only the net incremental shares (new shares issued minus shares repurchased) enter the denominator. For convertible debt or convertible preferred stock, the interest or preferred dividend saved (after tax) is added back to the numerator, and the shares that would result from conversion are added to the denominator.
Diluted EPS is almost always lower than basic EPS because the denominator grows while the numerator changes only modestly. Professional investors prefer diluted EPS for conservative analysis because it reflects the full potential dilution shareholders face.
| Instrument | Effect on Numerator | Effect on Denominator |
|---|---|---|
| Stock options / warrants | None (treasury stock method) | Increases by net incremental shares |
| Convertible debt | Add back after-tax interest saved | Increases by conversion shares |
| Convertible preferred stock | Add back preferred dividends | Increases by conversion shares |
Where to find EPS in company reports and filings
EPS is a required disclosure under U.S. GAAP and appears in several places across a company’s public filings.

Consolidated income statement: Both basic and diluted EPS appear at the bottom of the income statement, below net income. Most companies present them side by side.
Notes to the financial statements: The share-count calculation, including the weighted average methodology and any adjustments for stock splits or stock dividends, is detailed in the notes. This is where you verify the denominator.
Form 10-Q and Form 10-K: Quarterly and annual filings with the SEC contain audited or reviewed GAAP EPS figures. The SEC’s EDGAR database is the primary source for these documents.
Earnings press releases: Companies typically publish an earnings release before filing the 10-Q or 10-K. These releases often highlight non-GAAP or “adjusted” EPS alongside GAAP EPS. Watch for the reconciliation table, which shows how non-GAAP EPS differs from the GAAP figure. For a practical guide to reading these filings efficiently, SEC filing best practices from FilingsIQ.ai covers what analysts look for when extracting EPS-related disclosures.
How investors use EPS: valuation, comparisons, and trend analysis
EPS becomes most useful when paired with other data points. On its own, a single EPS figure tells you little; in context, it anchors a range of valuation and comparison techniques.
The P/E ratio connection: The price-to-earnings ratio is simply Price per share ÷ EPS. A stock trading at $42.60 with trailing EPS of $2.13 carries a P/E of 20x. That multiple is only meaningful when compared to peers or the company’s own historical range. EPS is a key input to P/E, which remains the most widely cited valuation metric in U.S. equity markets.
Best-practice comparison checklist:
- Compare EPS to direct industry peers, not the broad market, since capital intensity and margins vary widely by sector.
- Use trailing EPS (last twelve months) for backward-looking valuation and forward EPS (analyst consensus) for growth expectations, but treat forward estimates as projections, not guarantees.
- Normalize for one-time items: strip out gains from asset sales, restructuring charges, or litigation settlements before comparing periods.
- Always check EPS growth against revenue growth. EPS rising faster than revenue often signals buybacks or cost cuts rather than genuine top-line expansion.
Growth vs. value investors: Growth investors focus on the trajectory of EPS, expecting it to compound over time and justify a premium multiple. Value investors pair EPS with P/E and cash flow metrics to determine whether the market is pricing in too much or too little optimism. Neither camp treats EPS in isolation.
What moves EPS: buybacks, share issuance, and accounting choices
EPS can change for reasons that have nothing to do with how well a business actually performed. Understanding the drivers helps you separate real operating improvement from financial engineering.
Key drivers of EPS movement:
- Operating profit changes: Higher revenue or lower costs flow directly into net income and lift EPS. This is the driver investors should care most about.
- Share buybacks: Repurchasing shares reduces the denominator. Buybacks raise EPS even when net income is flat, which is why EPS growth alone is not sufficient evidence of business improvement.
- Share issuances: New shares from secondary offerings or employee stock compensation increase the denominator and dilute EPS.
- One-time gains and losses: A large asset sale or an impairment charge can swing EPS dramatically in a single quarter without reflecting ongoing earnings power.
- Discontinued operations: GAAP requires separate disclosure of discontinued operations, which can inflate or deflate reported EPS. Operating EPS from continuing operations is the more comparable figure.
- Stock splits: A 2-for-1 split doubles shares outstanding and halves EPS, but the economic value per share is unchanged. Prior periods are restated for comparability.
When EPS rises but revenue growth is flat or declining, check the share buyback activity and free cash flow. A company buying back stock with borrowed money can manufacture EPS growth that is not sustainable.
Limits and common pitfalls when using EPS
EPS is widely reported and easy to find, which makes it easy to misuse. A few structural limitations are worth keeping front of mind.
Common pitfalls:
- Ignoring dilution: Basic EPS overstates per-share earnings for companies with large option grants or convertible securities. Always check diluted EPS.
- Accepting non-GAAP EPS without scrutiny: Companies frequently report “adjusted” EPS that excludes stock-based compensation, amortization, or restructuring costs. These adjustments can be legitimate, but recurring “one-time” items that appear every quarter deserve skepticism.
- Small-company volatility: A single contract win or loss can swing EPS dramatically for a small company, making year-over-year comparisons unreliable without context.
- Capital-intensive businesses: EPS ignores the balance sheet. A company with heavy debt can report solid EPS while carrying a fragile capital structure.
Red flags to watch:
- A large and widening gap between basic and diluted EPS, suggesting heavy dilutive instrument issuance.
- EPS growth consistently outpacing revenue growth over multiple periods.
- Recurring “non-recurring” charges that keep appearing in the non-GAAP reconciliation.
- Significant differences between reported EPS and operating cash flow per share.
Worked numeric examples: computing basic and diluted EPS
Example 1: Basic EPS with a mid-year share change
Inputs:
- Net income: $12,000,000
- Preferred dividends: $0
- Shares outstanding January 1: 5,000,000
- Shares repurchased (bought back) July 1 (6 months remaining): 500,000
- Weighted average shares: 5,000,000 × (6/12) + 4,500,000 × (6/12) = 2,500,000 + 2,250,000 = 4,750,000
- Basic EPS: $12,000,000 ÷ 4,750,000 = $2.53
Interpretation: The buyback reduced the weighted average share count, lifting EPS above what it would have been on a full-year basis with 5,000,000 shares ($2.40). An investor should check whether net income also grew or whether the EPS gain came entirely from the reduced denominator.
Example 2: Diluted EPS with in-the-money options
Additional inputs from Example 1:
- Options outstanding: 400,000 at a strike price of $20
- Average market price during the period: $30
| Step | Calculation | Result |
|---|---|---|
| Shares issued on exercise | 400,000 | 400,000 |
| Proceeds from exercise | 400,000 × $20 | — |
| Shares repurchased at market | — ÷ $30 | — |
| Net incremental shares | 400,000 − — | — |
| Diluted share count | 4,750,000 + — | — |
| Diluted EPS | $12,000,000 ÷ — | $2.46 |
Interpretation: Dilution from the options reduced EPS from $2.53 to $2.46, a difference of $0.07 per share. For a company with tens of millions of shares and large option pools, this gap can be substantial. Investors running a P/E valuation should use the $2.46 diluted figure for a conservative estimate.
Tickerplace tools that help you compute and apply EPS
Running these calculations by hand is instructive, but doing it repeatedly across dozens of companies is where purpose-built tools pay off. Tickerplace provides free calculators and valuation models designed for exactly this workflow.
- EPS calculator: Enter net income, preferred dividends, and share counts to compute basic EPS instantly. The calculator also supports weighted-average inputs, so you can model mid-year share changes without manual arithmetic.
- Stock valuation calculator: Plug your EPS output directly into P/E and intrinsic value models. The tool runs multi-model valuation (DCF, P/E, P/S) and generates a fair value estimate you can compare against the current market price.
- Intrinsic value calculator: For investors who want to go beyond P/E, this tool feeds EPS and growth assumptions into a discounted earnings model to estimate intrinsic value per share.
- Company financials pages: Tickerplace displays EPS data alongside revenue, cash flow, and margin trends for thousands of U.S. and ASX-listed companies, updated daily. Cross-checking a company’s financial statements on the platform takes seconds rather than minutes of filing navigation.
Pro Tip: After computing EPS, always cross-check your figure against the GAAP EPS disclosed in the company’s most recent 10-Q or 10-K. Calculator outputs are only as accurate as the inputs you provide; model outputs should be verified against filed figures before making investment decisions.
Key Takeaways
Diluted EPS, paired with revenue growth and cash flow, gives a more complete and conservative picture of per-share profitability than basic EPS alone.
| Point | Details |
|---|---|
| Core EPS formula | EPS = (Net income − Preferred dividends) ÷ Weighted average common shares outstanding. |
| Basic vs. diluted | Diluted EPS includes potential shares from options, warrants, and convertibles; always use it for conservative analysis. |
| EPS is not dividends | EPS measures accounting profit per share; dividends are actual cash paid out, and the two move independently. |
| Context is required | No single EPS figure is “good” on its own; compare to industry peers, revenue growth, and cash flow for meaning. |
| Tickerplace tools | The free EPS calculator and stock valuation calculator let you compute and apply EPS across P/E and intrinsic value models. |
EPS in practice: a Tickerplace perspective
EPS is one of the most cited metrics in equity analysis, but it is also one of the most frequently misread. At Tickerplace, EPS is treated as a starting point, not a conclusion. The platform’s valuation workflow pairs diluted EPS with revenue growth trends and free cash flow to flag whether earnings gains reflect genuine operating improvement or simply a shrinking share count. When EPS and revenue diverge over multiple periods, that divergence is often more informative than the EPS figure itself.
The deeper issue is that EPS alone cannot tell you whether a stock is cheap or expensive. That determination requires pairing EPS with price to compute P/E, then stress-testing that multiple against intrinsic value models. A company trading at 30x earnings may be a bargain if EPS is compounding at 25% annually; the same multiple on a flat-earnings business is a different story entirely. Investors who skip that second step are reading only half the page.
Free EPS and valuation tools on Tickerplace
Tickerplace gives individual investors the same EPS-based valuation framework that institutional analysts use, at no cost. The free stock valuation calculator converts your EPS inputs into P/E and intrinsic value estimates across multiple models, so you can see at a glance whether a stock’s current price reflects its earnings power. For investors who want to go further, the intrinsic value calculator runs a discounted earnings model alongside P/S and DCF analysis, covering 10,000+ U.S. and ASX-listed equities updated daily.

Start with the EPS calculator to verify your inputs, then run the valuation check to see whether EPS growth is priced in or overlooked. Both tools are free, require no account to access, and take under two minutes to use.
Useful sources and further reading
- Investor.gov — Earnings Per Share: The SEC’s investor education glossary definition; the authoritative U.S. regulatory starting point for the EPS concept.
- Investopedia — EPS: What It Means and How to Calculate It: Covers the full EPS definition, formula variants, and the relationship between EPS, buybacks, and P/E valuation.
- Investopedia — Basic Earnings Per Share: Focused explanation of the basic EPS formula, weighted average shares, and the treasury stock method for dilution.
- Corporate Finance Institute — EPS Formula: Practitioner-level breakdown of EPS calculation variants, including when to use end-of-period versus weighted average shares.
- Wall Street Prep — EPS Formula + Calculator: Covers complex capital structures, diluted EPS mechanics, and how analysts model dilutive instruments in financial models.
- Wikipedia — Earnings Per Share: Broad reference covering U.S. GAAP and IFRS treatment, historical context, and links to related financial metrics.
- Tickerplace — EPS Calculator: Free tool to compute basic and diluted EPS and feed results into P/E and intrinsic value checks.
FAQ
What does earnings per share tell you?
EPS tells you how much profit a company generated for each share of common stock during a reporting period. A rising EPS over time generally signals improving profitability, though it should always be read alongside revenue growth and cash flow.
Is EPS the same as dividends?
No. EPS measures accounting profit allocated per share; dividends are actual cash payments the board chooses to distribute. A company can report high EPS and pay no dividend at all.
What is a good EPS?
There is no single “good” EPS figure; EPS is only meaningful relative to industry peers, the company’s own historical trend, and metrics like revenue growth and cash flow. A high EPS in a low-margin industry may be exceptional; the same figure in a high-margin sector may be underwhelming.
What is a good price-to-earnings ratio?
P/E benchmarks vary by sector and market cycle, so no universal threshold applies. Investors typically compare a stock’s P/E to its industry median and to the company’s own five-year average to judge whether the current multiple is elevated or compressed relative to historical norms.
Should I use basic or diluted EPS for valuation?
Use diluted EPS for valuation. It accounts for all potentially dilutive instruments, including options and convertibles, producing a more conservative and realistic per-share earnings figure than basic EPS.