
Trend Analysis: What It Is and How to Apply It
Trend analysis is the systematic process of examining historical data across multiple time periods to detect persistent directions or structural shifts that inform business and financial decisions. At its core, it answers one question: is this metric moving in a sustained direction, or is the movement just noise? In practice, that question surfaces in three recurring contexts: forecasting consumer demand before a product launch, spotting margin compression across quarterly income statements before it becomes a crisis, and informing capital allocation decisions by identifying which sectors or equities are in durable uptrends versus cyclical recoveries. The tools most analysts reach for range from Microsoft Excel for quick visual checks to Google Trends for search-interest signals to Python libraries like pandas and statsmodels for reproducible, large-scale workflows. Each of those tools appears in detail later in this guide.
Why trend analysis matters for business and finance
The practical value of trend analysis is not in the charts themselves but in what they prevent: reactive decisions based on a single bad quarter or a single strong month. Snowflake’s framework describes this as reducing “interpretive volatility” — the tendency of leaders to overreact to transient market noise when they lack a clear picture of structural direction. When you can separate a genuine downward trend in gross margin from a one-quarter cost spike, you make a fundamentally different decision about whether to launch a cost-control program or simply wait.
The core benefits of disciplined trend analysis include:
- Better capital allocation: Trend-informed signals help investors and managers direct resources toward compounding opportunities and away from eroding ones. Understanding asset allocation in this context becomes considerably more precise.
NetSuite’s strategic view adds an important governance point: the best organizations pair disciplined segmentation with trend analysis so findings drive strategic planning rather than remaining statistical exercises. That distinction separates organizations that act on trend data from those that merely report it.
Common trend types you’ll encounter and how to recognize them
The same data series can contain multiple trend types simultaneously. A retail company’s monthly revenue might show a long-term upward trend, a seasonal pattern that peaks every December, and a cyclical softening tied to the broader economic cycle. Recognizing which type you’re looking at determines which method you apply and which timeframe you choose.
| Trend Type | Typical Timescale | Visual Cue | Business Example |
|---|---|---|---|
| Upward (bullish) | Months to years | Rising slope across the series | Revenue growing 8% year-over-year for five consecutive years |
| Downward (bearish) | Months to years | Declining slope across the series | Gross margin contracting each quarter for six quarters |
| Flat / sideways | Variable | Horizontal band with no clear slope | Customer acquisition cost stable within a narrow range |
| Seasonal | Weeks to months, repeating | Regular peaks and troughs at fixed calendar intervals | E-commerce sales spiking every November–December |
| Cyclical | 2–10 years | Broad waves tied to economic expansion and contraction | Capital expenditure rising in expansion, falling in recession |
| Structural shift | Permanent | Abrupt or gradual change in the baseline level or slope | Post-pandemic shift in remote-work software adoption |
Investopedia categorizes trends by time horizon as short-term (days to weeks), intermediate (weeks to months), and long-term (months to years), which maps neatly onto the trading and investment contexts where these distinctions carry real portfolio consequences.
Common methods and statistical techniques for trend analysis
Choosing the right technique depends on the data’s characteristics, the question you’re answering, and the audience who will act on the results. Here is a practical overview of the core methods.
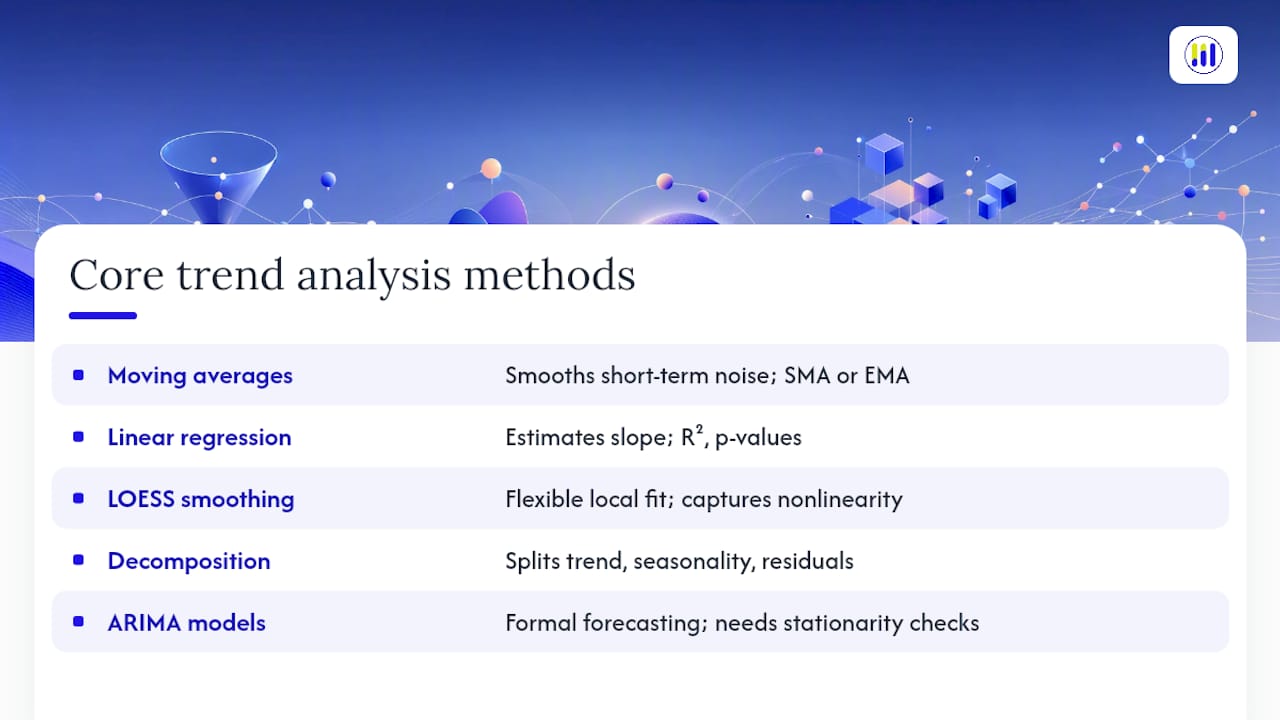
Moving averages smooth short-term fluctuations to reveal the underlying direction. A 12-month moving average applied to monthly revenue, for example, removes seasonal noise and shows whether the business is genuinely growing. Simple moving averages (SMA) weight all periods equally; exponential moving averages (EMA) weight recent periods more heavily, making them more responsive to recent changes. For stock market indicators, the 50-day and 200-day SMAs are among the most widely watched signals for trend confirmation.
Linear regression and trendlines estimate the slope of a series, quantifying how fast a metric is rising or falling per unit of time. In Microsoft Excel, a trendline added to a scatter plot gives you both the slope and the R-squared value in a few clicks. In Python, statsmodels.OLS produces the same output with confidence intervals and p-values, making it suitable for formal reporting.
LOESS smoothing (locally estimated scatterplot smoothing) fits a flexible curve to the data without assuming linearity. It is particularly useful when the trend changes direction over the observation period, as it captures bends that a straight regression line would miss.
Time-series decomposition separates a series into trend, seasonal, and residual components. Python’s statsmodels.tsa.seasonal_decompose handles this directly. Once seasonality is isolated, the underlying trend component is far cleaner and easier to interpret.
CAGR and year-over-year (YoY) growth are the most common business-facing metrics. CAGR (compound annual growth rate) expresses multi-year growth as a single annualized rate, making it easy to compare across companies or time periods. YoY compares the same period across consecutive years, controlling for seasonality automatically.
ARIMA models (autoregressive integrated moving average) extend trend analysis into formal forecasting. They are appropriate when you need a quantified forward projection with confidence intervals, not just a directional read. The statsmodels.tsa.arima.model.ARIMA class in Python handles this, though ARIMA requires stationarity checks and parameter tuning that simpler methods do not.
Non-parametric tests such as the Mann-Kendall test detect monotonic trends without assuming a normal distribution, making them useful for financial data that tends to be skewed or fat-tailed.
Pro Tip: Favor the simplest technique that answers the business question and can be explained to a non-technical stakeholder. A 12-month moving average in Excel is often more persuasive in a boardroom than an ARIMA model, even when the ARIMA is technically superior. Reserve complexity for situations where the decision stakes justify the additional validation burden.
How to perform a trend analysis step by step
A repeatable workflow prevents the most common failure mode in trend analysis: drawing conclusions from poorly scoped or uncleaned data.
- Define your objective and scope. State the specific question the analysis must answer (e.g., “Is our gross margin in the software segment trending down?”) and the metric, business unit, and time period in scope. Vague objectives produce vague findings.
- Choose your timeframe. Match the timeframe to the trend type you expect. Seasonal patterns need at least two to three full cycles; long-term structural trends need multi-year data. Shorter windows increase the risk of mistaking noise for signal.
- Collect and clean your data. Pull data from authoritative internal sources (ERP, financial statements, CRM) or external sources (government databases, Google Trends, market data providers). Remove duplicates, handle missing values consistently, and document every adjustment. Reading market data carefully before analysis is a step many practitioners skip, often to their cost.
- Select your method. Match the technique to the data’s characteristics: use moving averages for smoothing, regression for slope estimation, decomposition when seasonality is present, and ARIMA when a forward projection is required.
- Run the analysis. Execute in Excel, Python, or your BI tool of choice. Produce the primary output (chart, regression table, decomposition plot) and document the parameters used.
- Validate and run robustness checks. This step is where most informal analyses fall short.
- Interpret results. Translate statistical outputs into plain-language directional statements: “Gross margin has declined at approximately X percentage points per quarter over the past eight quarters.”
- Report and recommend actions. Present findings with a headline insight, an annotated chart, a method summary, stated confidence and limitations, and a specific recommended action.
Reporting checklist
A complete trend analysis report or dashboard slide should include: the headline directional finding in plain language; a line chart with the raw series, the trend line or moving average overlay, and annotated inflection points; a one-paragraph method summary; explicit confidence and limitations; and a recommended action tied to the finding.
Limitations, common pitfalls, and exactly how to avoid them
Trend analysis is only as reliable as the discipline applied to it. These are the failure modes that appear most often in practice, along with concrete mitigations.
- Data quality issues: Missing values, restated financials, or inconsistent definitions across periods corrupt the trend signal. Mitigation: document data sources and any adjustments; flag restated periods explicitly. Consistent income tracking and clean data hygiene are prerequisites for reliable output.
When presenting findings, state confidence explicitly. A slide that shows a trend without a confidence interval or a note on statistical significance invites overconfidence. A simple phrase like “this trend is statistically significant at the 95% confidence level based on eight quarters of data, but the slope estimate carries a margin of error of ±X percentage points” is more credible than a clean chart with no caveats.
Practical business and financial examples
Retail demand forecasting
A regional grocery chain wants to plan inventory for the next six months. The analyst pulls 36 months of weekly unit sales by product category, applies a 4-week moving average to remove weekly noise, and then runs a linear regression on the smoothed series to estimate the underlying growth rate. Seasonal decomposition confirms a consistent summer peak in beverage sales. The output: a category-level demand forecast with a seasonal adjustment factor, which the purchasing team uses to set reorder quantities. The trend analysis connects directly to a cash flow decision, since over-ordering ties up working capital while under-ordering loses revenue. Sound cash flow management depends on exactly this kind of forward visibility.
Detecting margin compression in financial statements
A financial analyst reviewing five years of quarterly income statements notices that gross margin has declined from 42% to 36% over 20 quarters. Trend analysis of financial statements — expressing each period’s figures as both dollar-amount changes and percentage ratios relative to a base period — makes the compression visible in a single chart. The analyst runs a linear regression on the gross margin percentage series and finds a statistically significant negative slope. That finding triggers a cost-structure review rather than a wait-and-see posture.
A worked mini stock trend example
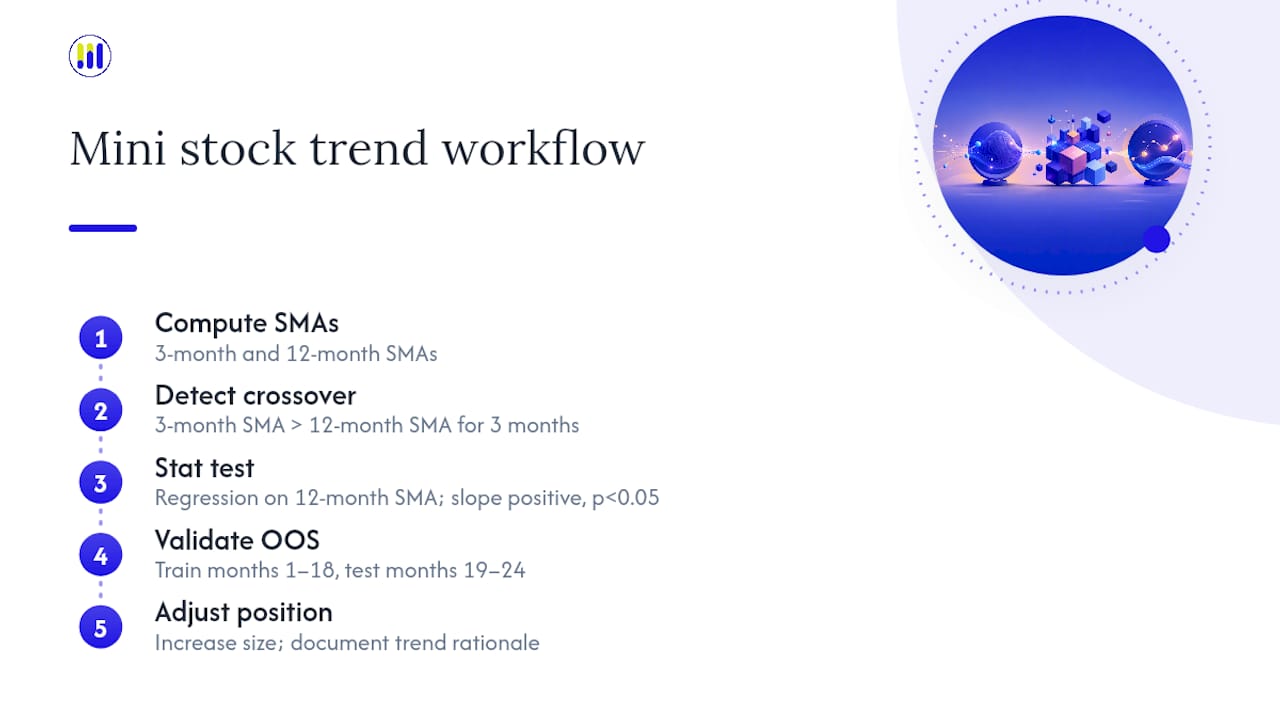
Consider a hypothetical stock with 24 months of closing prices. The analyst calculates a 3-month SMA and a 12-month SMA, then plots both overlays on the price series. When the 3-month SMA crosses above the 12-month SMA and holds for three consecutive months, that signals a potential upward structural shift rather than a short-term bounce. A linear regression on the 12-month SMA series produces a positive slope with a p-value below 0.05, confirming the trend is statistically distinguishable from noise. The analyst then checks whether the trend holds in an out-of-sample window (months 19–24) by estimating the model on months 1–18 and comparing the projected direction to actual prices. The validation passes. The practical output: the portfolio manager increases the position size, with a documented rationale tied to the trend evidence rather than a price-target guess. Identifying market trends with this level of rigor is what separates disciplined investing from pattern-chasing.
Coursera notes that analysts also look for whether trends in one business area may lead to trends in another, which is particularly relevant when cross-sector signals (e.g., rising freight costs) precede margin compression in downstream industries.
What tools and resources do you need for trend analysis?
The right tool depends on dataset size, reproducibility requirements, and the technical level of your audience.
- What Is Trend Analysis? Types & Best Practices | NetSuite
- What Is Trend Analysis? How to Analyze Trends Step by Step | Snowflake
- What Is Trend Analysis in Business? | Coursera
- Trend Analysis & Trading Strategies: Predict Market Movements | Investopedia
- Trend analysis — Wikipedia
- 13.1 Trend Analysis of Financial Statements
- What is trend analysis
- Tickerplace - Stock Market, Research & Analysis Tool.
For learning resources, the statsmodels documentation and the pandas time-series guide are the most practical starting points for Python users. For financial statement trend analysis, the Saylor Foundation’s managerial accounting text provides a clear worked example of base-period indexing.
Key Takeaways
Trend analysis is most reliable when it combines a clearly scoped question, clean multi-period data, an appropriate statistical method, and explicit validation checks before any finding reaches a decision-maker.
| Point | Details |
|---|---|
| Core definition | Trend analysis examines historical data over time to detect sustained directions or structural shifts that inform decisions. |
| Start with moving averages | A 12-month moving average in Excel is often the fastest, most communicable first check for any business metric. |
| Validate before you present | Always run an out-of-sample check and confirm statistical significance; a visually clear trend can still be noise. |
| Match method to question | Use decomposition when seasonality is present, regression for slope estimation, and ARIMA only when a formal forecast is required. |
| Apply it to stock research | Tickerplace provides daily intrinsic value estimates and multi-model valuation for 10,000+ equities, giving investors a structured basis for tracking structural valuation shifts. |
The structural shift you’re probably missing
Most practitioners spend the bulk of their time asking whether a trend exists. The more consequential question is whether the trend has changed. A company can show a positive revenue slope for five years and still be in serious trouble if the slope has been flattening for the last six quarters. That bend in the trend line, not the trend itself, is where the real signal lives.
The governance habits that make trend analysis durable are straightforward but rarely followed consistently: document the method and parameters used each time, version-control the analysis so you can compare this quarter’s model to last quarter’s, and set explicit triggers for when a finding warrants action versus monitoring. Without those habits, trend analysis becomes a reporting exercise rather than a decision tool.
Pairing trend analysis with scenario testing adds another layer of rigor. A trend that holds under the base case but reverses under a modest stress assumption is a weaker basis for action than one that is robust across scenarios. The organizations that get the most value from trend analysis are those that treat it as an ongoing discipline with defined review cadences, not a one-time project.
Trend analysis applied to stock valuation with Tickerplace
For investors who want to apply trend analysis directly to stock research, Tickerplace offers institutional-grade valuation tools without the institutional price tag. The platform’s daily intrinsic value estimates, updated across 10,000+ US and ASX-listed equities, give you a consistent data series to track structural valuation shifts over time rather than reacting to daily price moves.

Two capabilities are particularly useful for trend-driven decisions:
- Multi-model valuation (DCF, P/E, P/S): Running the same stock through multiple valuation models over time reveals whether the intrinsic value estimate itself is trending, which is a more durable signal than price momentum alone.
- Intrinsic value calculator and scenario testing: Adjust key assumptions and observe how the fair value estimate responds, giving you a structured way to stress-test a trend-based thesis before committing capital.
Start with a free account at Tickerplace and run a valuation check on any stock you’re currently tracking.
Useful sources and further reading
The following sources informed this article and offer deeper reading on specific aspects of trend analysis:
- NetSuite: What Is Trend Analysis? Types & Best Practices — Comprehensive business-strategy framing, governance guidance, and best practices.
- Snowflake: What Is Trend Analysis? How to Analyze Trends Step by Step — Step-by-step methodology, diagnostic questions, and the concept of interpretive volatility.
- Coursera: What Is Trend Analysis in Business? — Cross-domain applications and how industry-level trends connect to firm-level forecasts.
- Investopedia: Trend Analysis & Trading Strategies — Financial and trading applications, time-horizon categories, and common technical indicators.
- Wikipedia: Trend analysis — Formal statistical methods including Mann-Kendall testing, decomposition, and smoothing.
- Saylor Foundation: 13.1 Trend Analysis of Financial Statements — Worked examples of base-period indexing and ratio analysis for income statements and balance sheets.
- BDC: What is trend analysis — Accessible glossary definition with cross-industry context and Google Trends as a practical tool.
- Tickerplace: Stock Market, Research & Analysis Tool — Daily intrinsic value estimates and multi-model valuation for applying trend-informed stock research.
FAQ
What is trend analysis in simple terms?
Trend analysis is the process of examining data over multiple time periods to determine whether a metric is consistently moving up, down, or sideways. It separates sustained directional movement from short-term noise to support better business and financial decisions.
What are the most common trend analysis techniques?
Moving averages, linear regression trendlines, year-over-year comparisons, CAGR, and time-series decomposition are the most widely used techniques. For formal statistical testing, the Mann-Kendall test and ARIMA models are standard options.
How do you validate a trend analysis finding?
Run an out-of-sample check by estimating the trend on a subset of the data and testing whether it holds on the withheld periods. Also confirm statistical significance using a p-value from regression or a non-parametric test, and check whether the conclusion changes if you shift the start date by one or two periods.
How does trend analysis apply to stock investing?
In investing, trend analysis examines historical price data, earnings trajectories, and valuation metrics over time to identify whether a stock or sector is in a durable uptrend or structural decline. Platforms like Tickerplace provide daily intrinsic value estimates across 10,000+ equities, giving investors a consistent data series for tracking valuation trends rather than reacting to short-term price moves.
What is the difference between a seasonal trend and a cyclical trend?
A seasonal trend repeats at fixed calendar intervals (monthly, quarterly, annually) and is driven by predictable factors like weather or holidays. A cyclical trend spans multiple years and is tied to broader economic expansion and contraction cycles, making it less predictable in timing and magnitude.