
A Market Research Process for Long-Term Stock Investors

The market research process for a long-term investor follows a fixed sequence: define an objective and a testable thesis, analyze the company’s 10-K filings and key ratios, build valuation ranges using DCF and multiples like P/E, weigh industry and macro conditions, set a margin of safety, then document the decision and monitor it. Each step feeds the next, and skipping one usually shows up later as an unpleasant surprise in the position. This is not a one-afternoon exercise. It is a repeatable workflow you can run on any stock, produce a documented decision from, and revisit when the facts change.
Key Takeaways
A repeatable, valuation-first research process turns a stock idea into a documented decision by pairing scenario-based valuation with a clear margin of safety.
| Point | Details |
|---|---|
| Thesis comes first | Write what must be true and the single event that would invalidate the position before building any model. |
| Use ranges, not points | Bear, base, and bull valuation cases prevent false confidence in one “fair value” number. |
| Margin of safety sets action | Translate the valuation range into a specific target buy price before you look at the current market price. |
| Monitoring is scheduled, not optional | Quarterly filings and material events should trigger a documented review, not a silent shrug. |
| Tickerplace speeds cross-checking | Its DCF, P/E, and P/S models and margin-of-safety calculators let you validate your own valuation work across 10,000+ equities daily. |
What Are the Steps of the Market Research Process?
Running this process well means treating it as a checklist, not a vibe. Here is the sequence, with rough time estimates for a single stock:
- Set the objective and time horizon — decide the portfolio role this stock would play and your risk tolerance for it.
- Draft the investment thesis — write down what must be true for the stock to work.
- Pull primary filings — annual reports, quarterly filings, investor presentations.
- Compute financial ratios — profitability, leverage, and cash flow metrics from the statements.
- Build a DCF and multiples valuation — bear, base, and bull cases with explicit assumptions.
- Layer in industry and macro context — competitive position, rate environment, cyclicality.
- Calculate margin of safety and risk table — translate the valuation range into a target buy price.
- Write the investment memo — the decision, drivers, and invalidation triggers.
- Set the monitoring cadence — what to recheck and when.
Budget a weekend for the first pass on a new name; updates on an existing holding take a fraction of that.
How Do You Define an Investment Thesis Before Researching a Stock?
Start with the objective, not the stock. A retiree building income has different acceptance criteria than a 30-year-old adding growth exposure, and that difference shapes how much valuation risk you’re willing to tolerate before you’ve looked at a single filing.
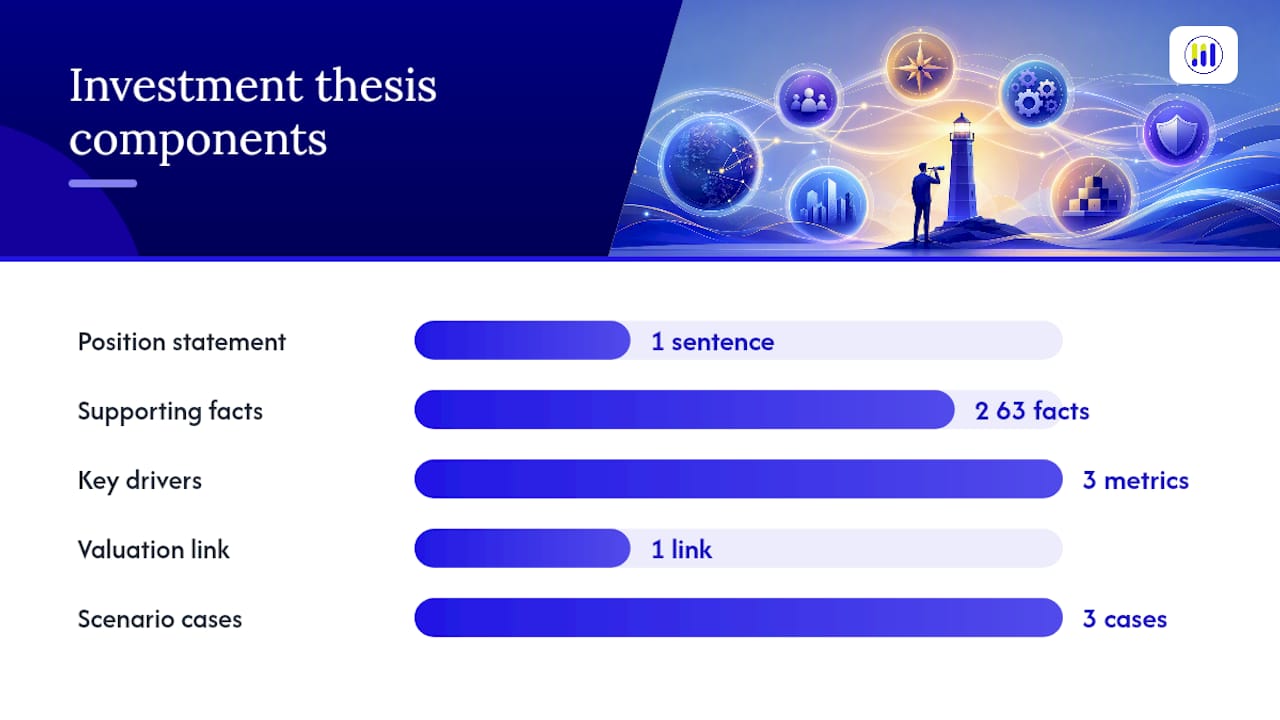
From there, write a thesis using a fixed template:
- Position statement: what you believe about the stock in one sentence.
- What must be true: the two or three business facts that support the claim.
- Key drivers: the metrics that will confirm or deny those facts (revenue growth rate, margin trend, market share).
- Valuation link: how those drivers translate into your DCF or multiple assumptions.
A structured investment thesis separates the claim from the evidence and states clearly what would break it, which is what keeps you from rationalizing a bad position later.
Pro Tip: Write three short scenario cases, bear, base, and bull, and name the single metric or event, a margin miss, a lost contract, a rate spike, that would flip your thesis from “hold” to “sell.” If you can’t name that trigger, the thesis isn’t finished.
Where Do You Find Reliable Financial Data on a Company?
Primary sources beat secondhand summaries every time. For US-listed companies, that means SEC EDGAR filings and the company’s own investor relations page; for ASX names, the equivalent is the company’s announcements platform and annual report. Audited annual and quarterly reports are your baseline. Earnings call transcripts and investor presentations fill in management’s own framing of the numbers.
Once you have the filings, work through the three statements together rather than in isolation. The income statement tells you if the business is growing and how profitably; the balance sheet tells you what it owns and owes; the cash flow statement tells you whether reported profit is actually turning into cash. From there, compute:
- Profitability: ROIC, ROE, gross and operating margins.
- Cash generation: free cash flow and free cash flow margin.
- Balance sheet strength: debt-to-equity, current ratio, quick ratio.
- Trend, not snapshot: three to five years of each, not a single quarter.
Fundamental analysis of this kind evaluates the statements alongside industry conditions and management quality to estimate a company’s intrinsic value, which is the whole point of doing it. Watch for red flags along the way: receivables growing faster than sales, frequent “one-time” charges, or off-balance-sheet obligations tucked into the footnotes. Our guide to fundamental analysis breaks down how to read these ratios in context rather than in isolation.
How Do You Value a Stock Using DCF and Multiples?
Discounted cash flow works best on businesses with predictable, forecastable cash flows, mature industrials, consumer staples, established software companies. For earlier-stage or cyclical names, relative multiples like P/E, EV/EBITDA, and P/S often give a more honest cross-check, since they anchor your estimate to what the market is actually paying for similar businesses right now.
The real value of a DCF isn’t the single number it spits out. It’s what happens when you build three versions of it:
- Bear case: slower revenue growth, margin compression, a higher discount rate reflecting added risk.
- Base case: your best estimate of consensus, using guidance and historical trend.
- Bull case: upside from margin expansion, market share gains, or a lower cost of capital.
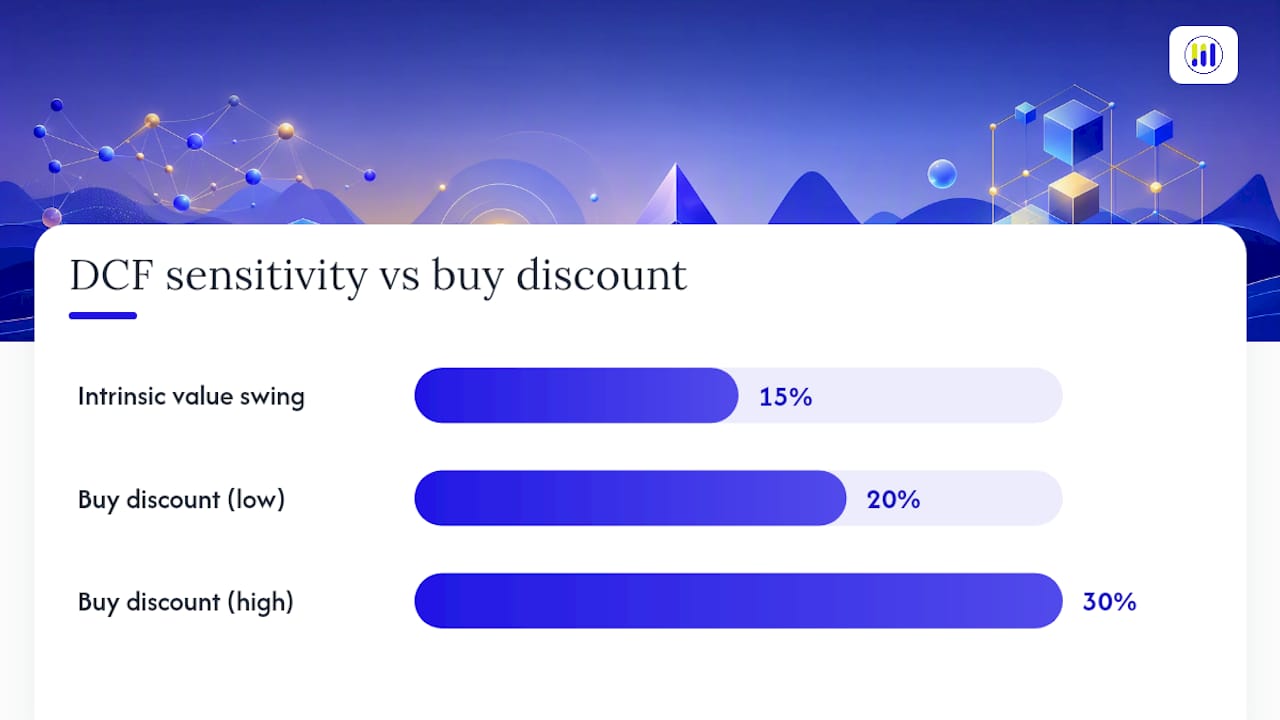
Run a quick sensitivity check on top of that. A discount rate move of just 100 to 200 basis points, or a margin swing of the same size, can shift intrinsic value by 15% or more on a long-duration cash flow model. That sensitivity is the reason a single-point “fair value” number is close to meaningless on its own; using scenario ranges instead of one estimate avoids the false confidence a lone figure creates.
Pro Tip: Set your action threshold before you know the answer. Decide in advance that you’ll only buy at a 20% to 30% discount to your base-case fair value, then let the math tell you if the current price clears that bar, not the other way around.
Analysts who chase “quality” names without this discipline routinely overpay for good businesses, because a great company at the wrong price is still a bad trade.
Which Industry and Macro Factors Change Your Valuation?
A DCF built in isolation from the industry it sits in is fiction. Before locking in assumptions, check:
- Market size and growth rate for the company’s core segment.
- Competitive dynamics, market share trends, pricing power, and new entrants.
- Regulatory exposure, especially for utilities, healthcare, and financials.
- Cyclicality, whether earnings swing hard with the economic cycle.
On the macro side, interest rates, inflation expectations, and GDP growth all flow directly into your discount rate and terminal growth assumptions. A property or macro cashflow model makes a useful comparison point here: real assets and equities respond to rate cycles in related but distinct ways, and both remind you that a rising-rate environment should push your discount rate up and your terminal multiple down, not just in the model, but in the confidence you assign to the bull case.
How Do You Calculate a Margin of Safety?
Risk assessment starts with naming the categories: business model risk (does the moat hold?), financial leverage (can the balance sheet survive a downturn?), execution risk (can management deliver the plan?), regulatory risk, and macro sensitivity. Each deserves a real example, not a generic worry.
The margin of safety itself is arithmetic. If your base-case intrinsic value is at a certain level and you apply a discount for safety, your target buy price is correspondingly lower. Anything above that, you wait or watch; below it, you have room to act.
A simple risk table keeps this honest:
| Risk | Probability | Impact | Monitoring Trigger |
|---|---|---|---|
| Margin compression from input costs | Moderate | High | Quarterly gross margin trend |
| New regulation in core market | Low | High | Regulatory filings, earnings calls |
| Rising leverage | Moderate | Moderate | Debt-to-equity, interest coverage |
How Do You Turn Research Into a Buy, Hold, or Sell Decision?
Everything above exists to produce one documented output: a memo. Keep it short.
- Position statement: your one-sentence call.
- Valuation range: bear, base, bull fair value figures.
- Key drivers: the two or three metrics the thesis rides on.
- Risks: pulled straight from your risk table.
- Invalidation triggers: the specific event that changes the call.
- Position sizing guidance: how big this position should be given conviction and risk.
Set a monitoring cadence: quarterly financials at minimum, plus any material filing or management commentary that touches your key drivers. A properly built investment thesis names the evidence that would weaken it and a schedule for checking that evidence, which is what separates a real decision from a hunch. Routine reviews happen on schedule; a missed earnings target or a leadership change demands an off-cycle look immediately.
What Tools and Data Sources Speed Up Stock Research?
Primary filings stay non-negotiable, EDGAR, exchange announcement platforms, and company investor relations pages. For cross-checking, independent research that shows its math and discloses its assumptions is worth more than a flashy buy alert with no methodology behind it, a point echoed across self-directed investor research guides.
On the tools side, you need three things: a spreadsheet template for your DCF, a multiples screener for cross-checks, and a way to sanity-check your own math against a second model. This is where Tickerplace fits directly into the workflow: multi-model valuation combining DCF, P/E, and P/S, daily-updated intrinsic value estimates across 10,000+ US and ASX equities, and built-in margin-of-safety calculators that turn your valuation range into an actual target price. Our piece on analyzing stocks for smarter decisions walks through pairing these outputs with your own filings-based work rather than replacing it.
A valuation-first perspective on doing this well
Overconfidence is the most common failure mode here, not laziness. A single “fair value” number feels more rigorous than a range, but it’s usually just false precision. Favor ranges, write your assumptions down where you’ll actually reread them, and triangulate: run the DCF, check it against P/E and comparable companies, and treat the resulting thesis as a living document, not a verdict carved in stone.
Run Your Valuation Faster With Tickerplace’s Free Tools
Tickerplace gives long-term investors the same multi-model valuation approach institutional analysts use, without the subscription costs that usually come with it. Once you’ve built your bear, base, and bull cases by hand, cross-check them against Tickerplace’s daily-updated DCF, P/E, and P/S estimates across more than 10,000 US and ASX-listed equities.

If you’re testing a specific thesis right now, head straight to the intrinsic value calculator to build a DCF-based range, or use the stock valuation checker to see whether the market price already reflects your bull case. Adding to an existing position? The stock average price calculator helps you see what a new buy does to your cost basis before you commit. The free tier covers the core valuation outputs; upgrading to Tickerplace Pro unlocks full DCF breakdowns, exportable scenario analysis, and historical financials for building out your memo template in depth. Start with a ticker you already own and see where your own numbers land against the model.
Sources
Save these alongside your own memo template so each new stock follows the same structure you built here.
This article is general information, not a substitute for advice from a qualified financial advisor. Consult a qualified financial professional about your own circumstances before acting on anything here.
FAQ
What Is the First Step in Researching a Stock?
Define your investment objective and time horizon first, then write a testable thesis. Skipping straight to valuation without a thesis makes it too easy to rationalize a number you already wanted to see.
How Long Should Stock Research Take?
A full first pass on a new stock, filings review, ratio work, DCF and multiples, and a memo, typically takes a weekend. Updates on an existing holding take an hour or two once the template exists.
What’s the Difference Between DCF and Multiples Valuation?
DCF estimates intrinsic value from projected cash flows and a discount rate, which works best for businesses with predictable cash generation. Multiples like P/E and P/S compare a stock’s price to peers and serve as a faster cross-check.
How Do You Calculate Margin of Safety?
Take your base-case intrinsic value and apply a discount, often 20% to 30%, to set a target buy price. If the current market price sits below that target, the margin of safety supports a buy decision.
Can Tickerplace Replace Manual Valuation Work?
Tickerplace’s DCF, P/E, and P/S models are built to cross-check your own valuation work, not replace the thesis-writing and filings review that anchor a sound decision. It speeds the math and documentation; the judgment calls still belong to you.